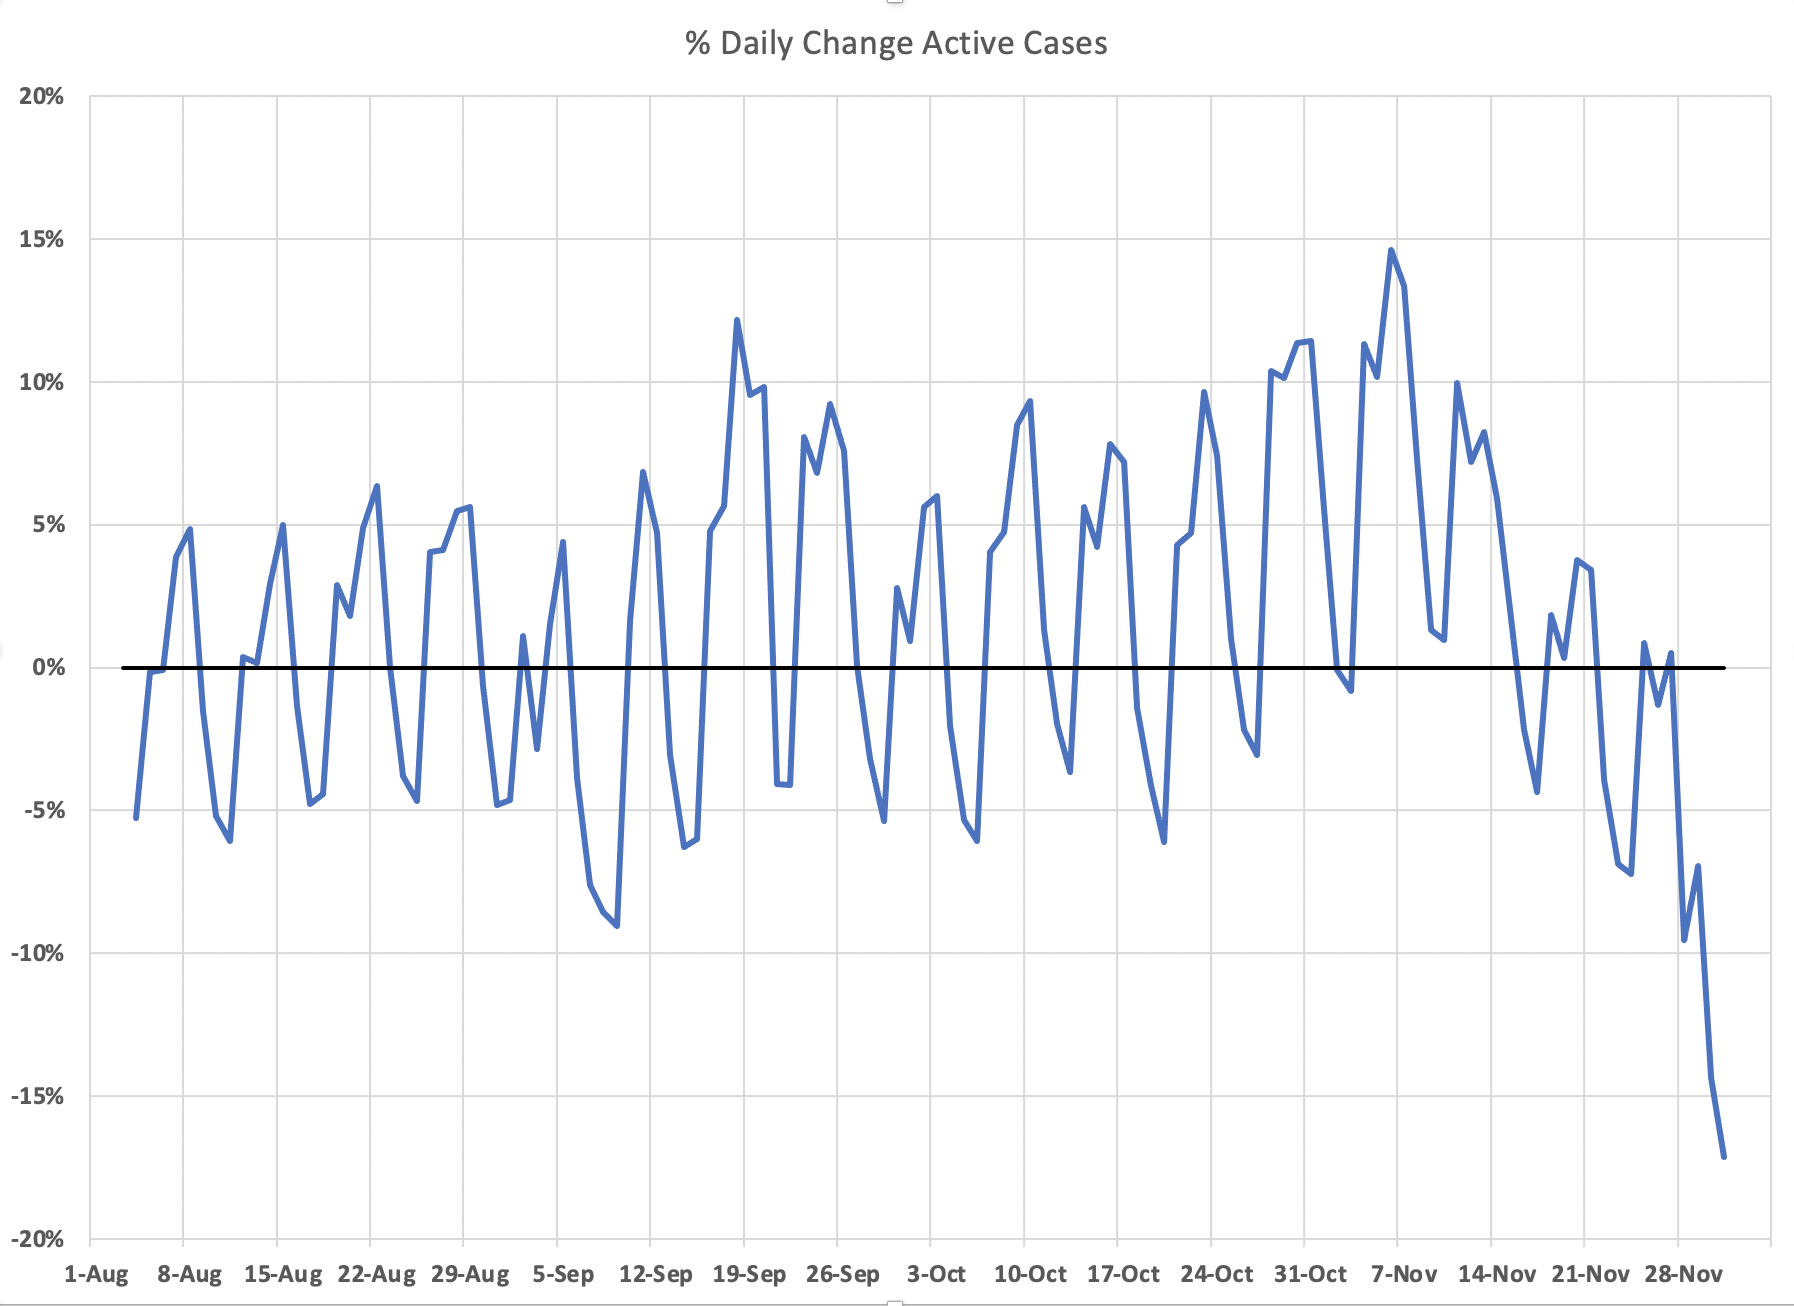
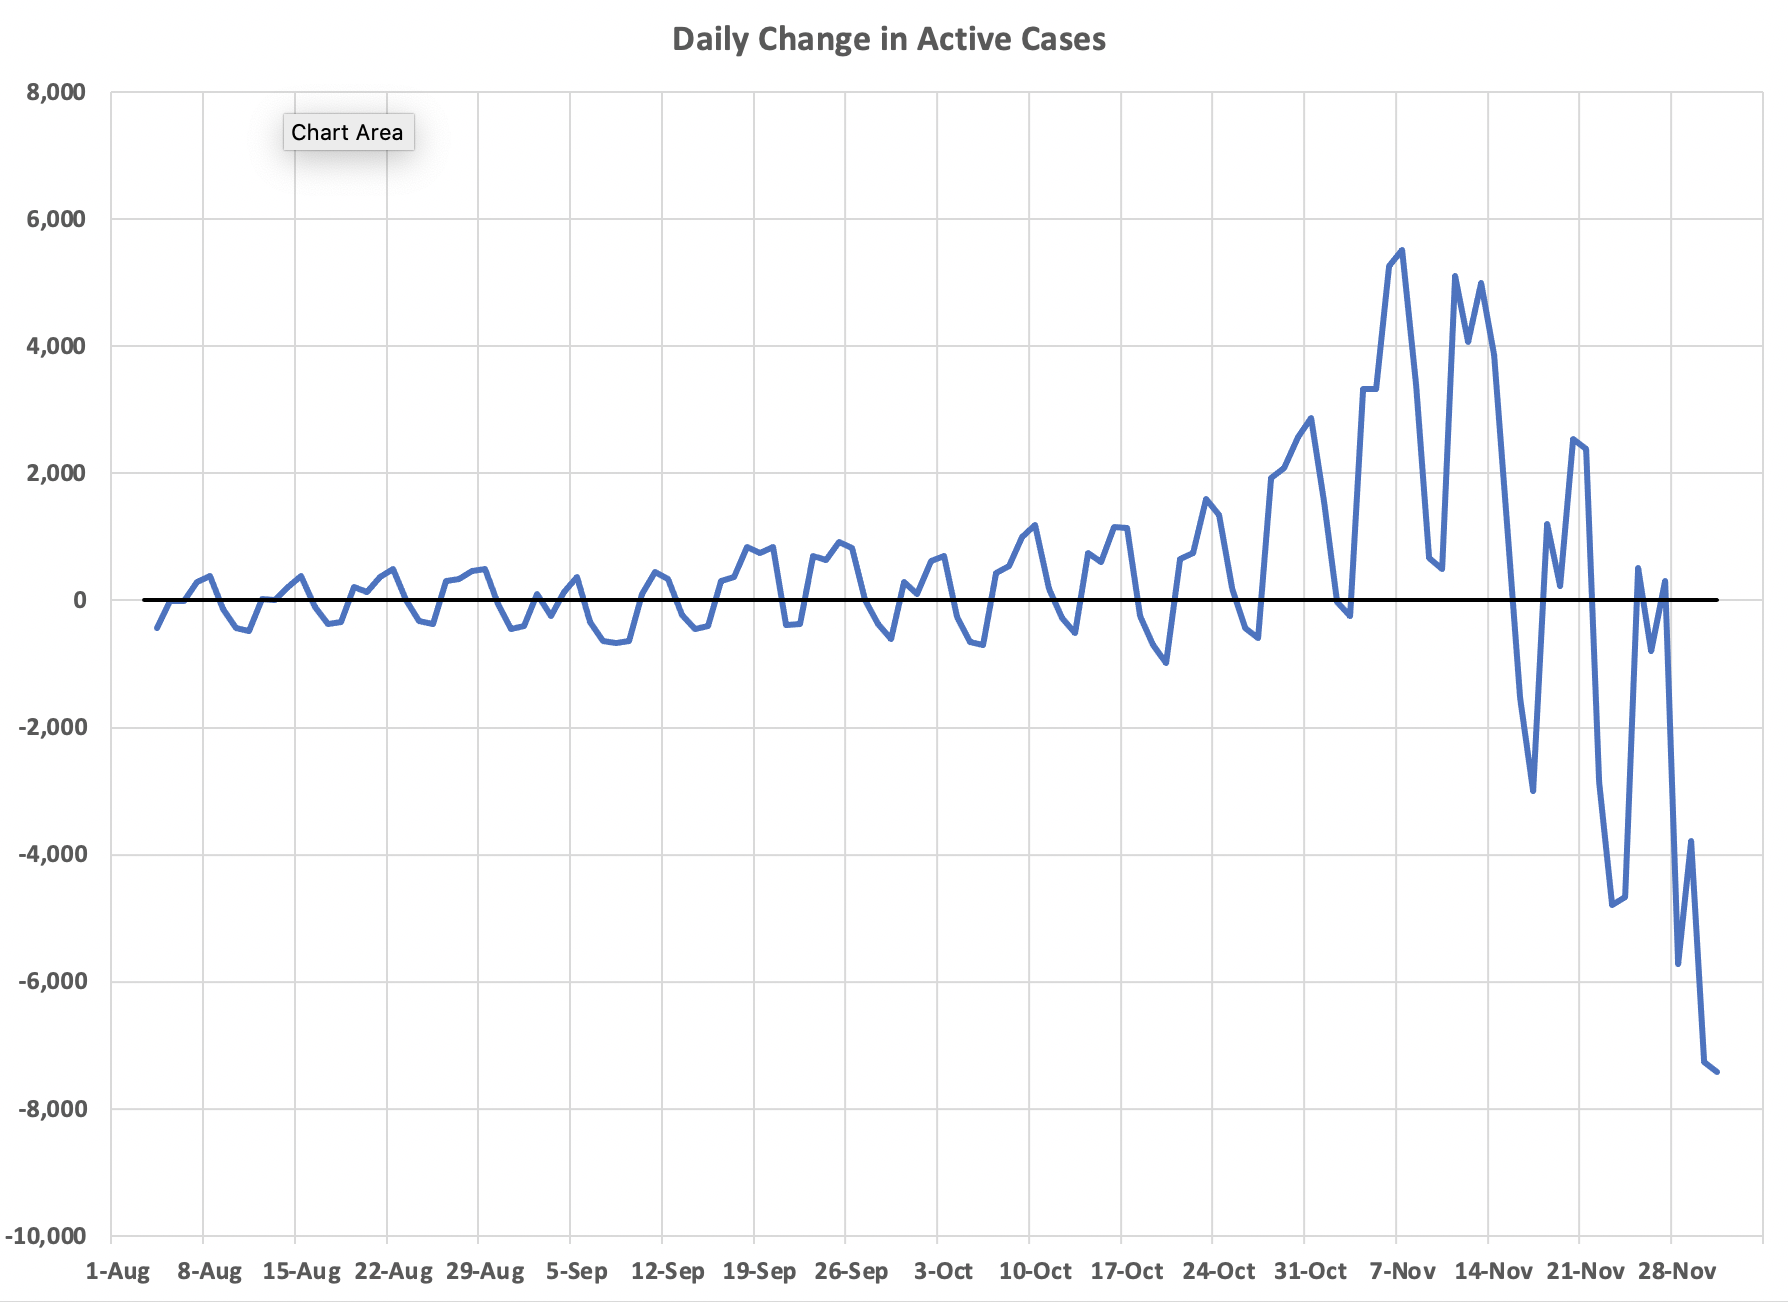
Another update on this, I am focussed on it because I do believe we have peaked in this wave, and this is the best way to see it. Also, thanks again to DD and Lisa Jansa for the help and DD in particular for finding info from the DOH about how certain data is used. Turns out they only roll off positive PCR test cases after 10 days into the no longer needing isolation bucket, so I adjusted total cases to account for that. No telling what their formula for that NLNI number is, I can’t match it no matter how hard I try, but it clearly is people they don’t think are infectious, either because of the passage of time or they are symptom free or something. And since the NLNI number does not get a daily refresh to match changes in the cases by date of specimen collection, the active case number will be an over count, but the trend is solid, I believe. And the trend is pretty clear. The charts below reflect data through yesterday. It is a bit of a pain to update this every day because you have to update several weeks of the total cases column. But I will keep doing it at least every two to three days for a while.
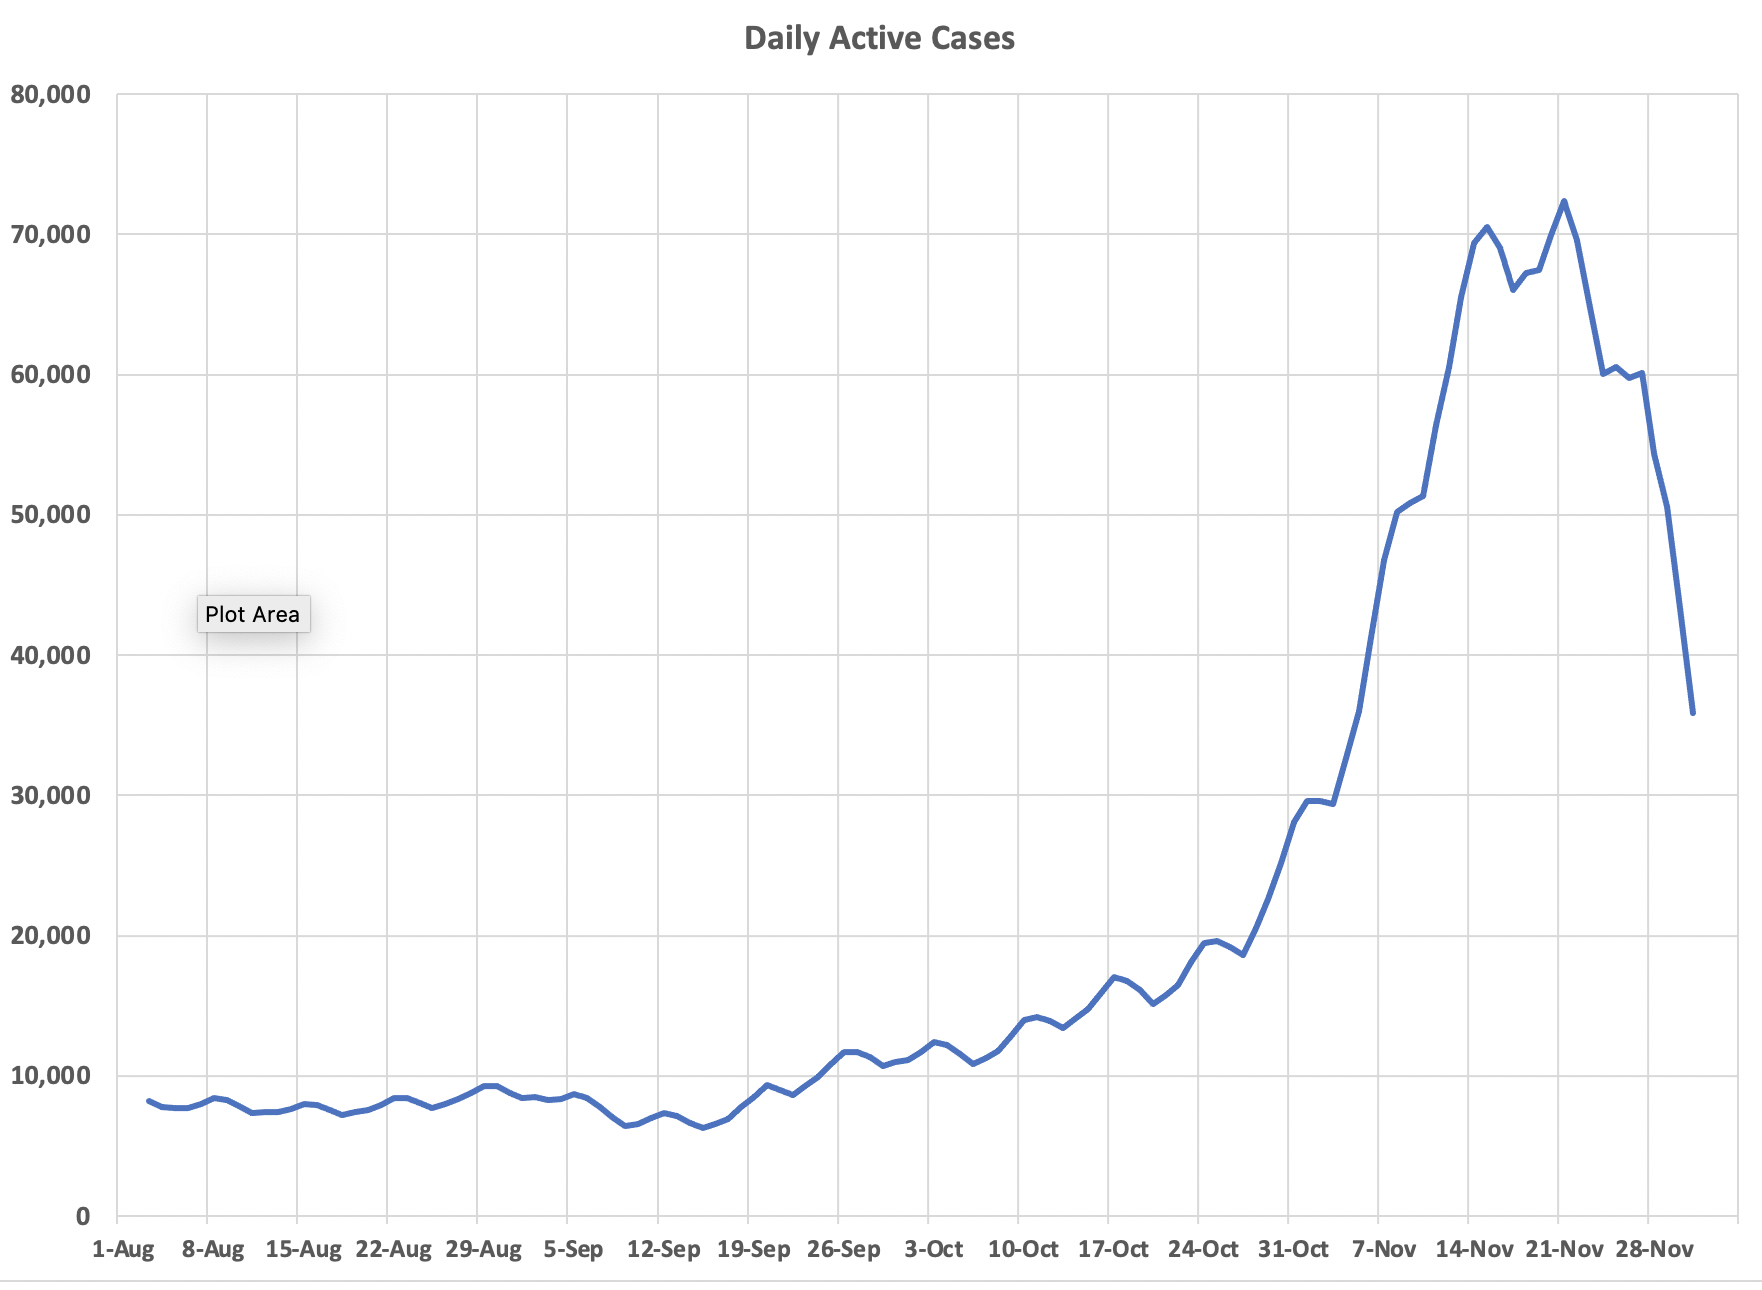

Worldometers has an estimate of active cases as well – doesn’t look terribly far off of yours, but would be worth doing a bit of analysis to make sure all the effort produces enough improvement on their estimate to continue doing. Same story though: already a massive drop off of cases, proving that the peak was past before the latest lockdown was ordered. https://www.worldometers.info/coronavirus/usa/minnesota/
Thank you to those contributing to having an alternate method for validation, and of course as always Kevin for your tireless work!
Recent headlines claimed North Dakota had the highest Covid mortality rate in the world. Liberals find a great deal of shadenfreude in that, of course. Those stupid anti-maskers are getting what they deserve.
What’s your take? Why is their mortality rate so high? Is it a case of manipulating statistics? A large influx of migrant workers? Cold air from Canada?