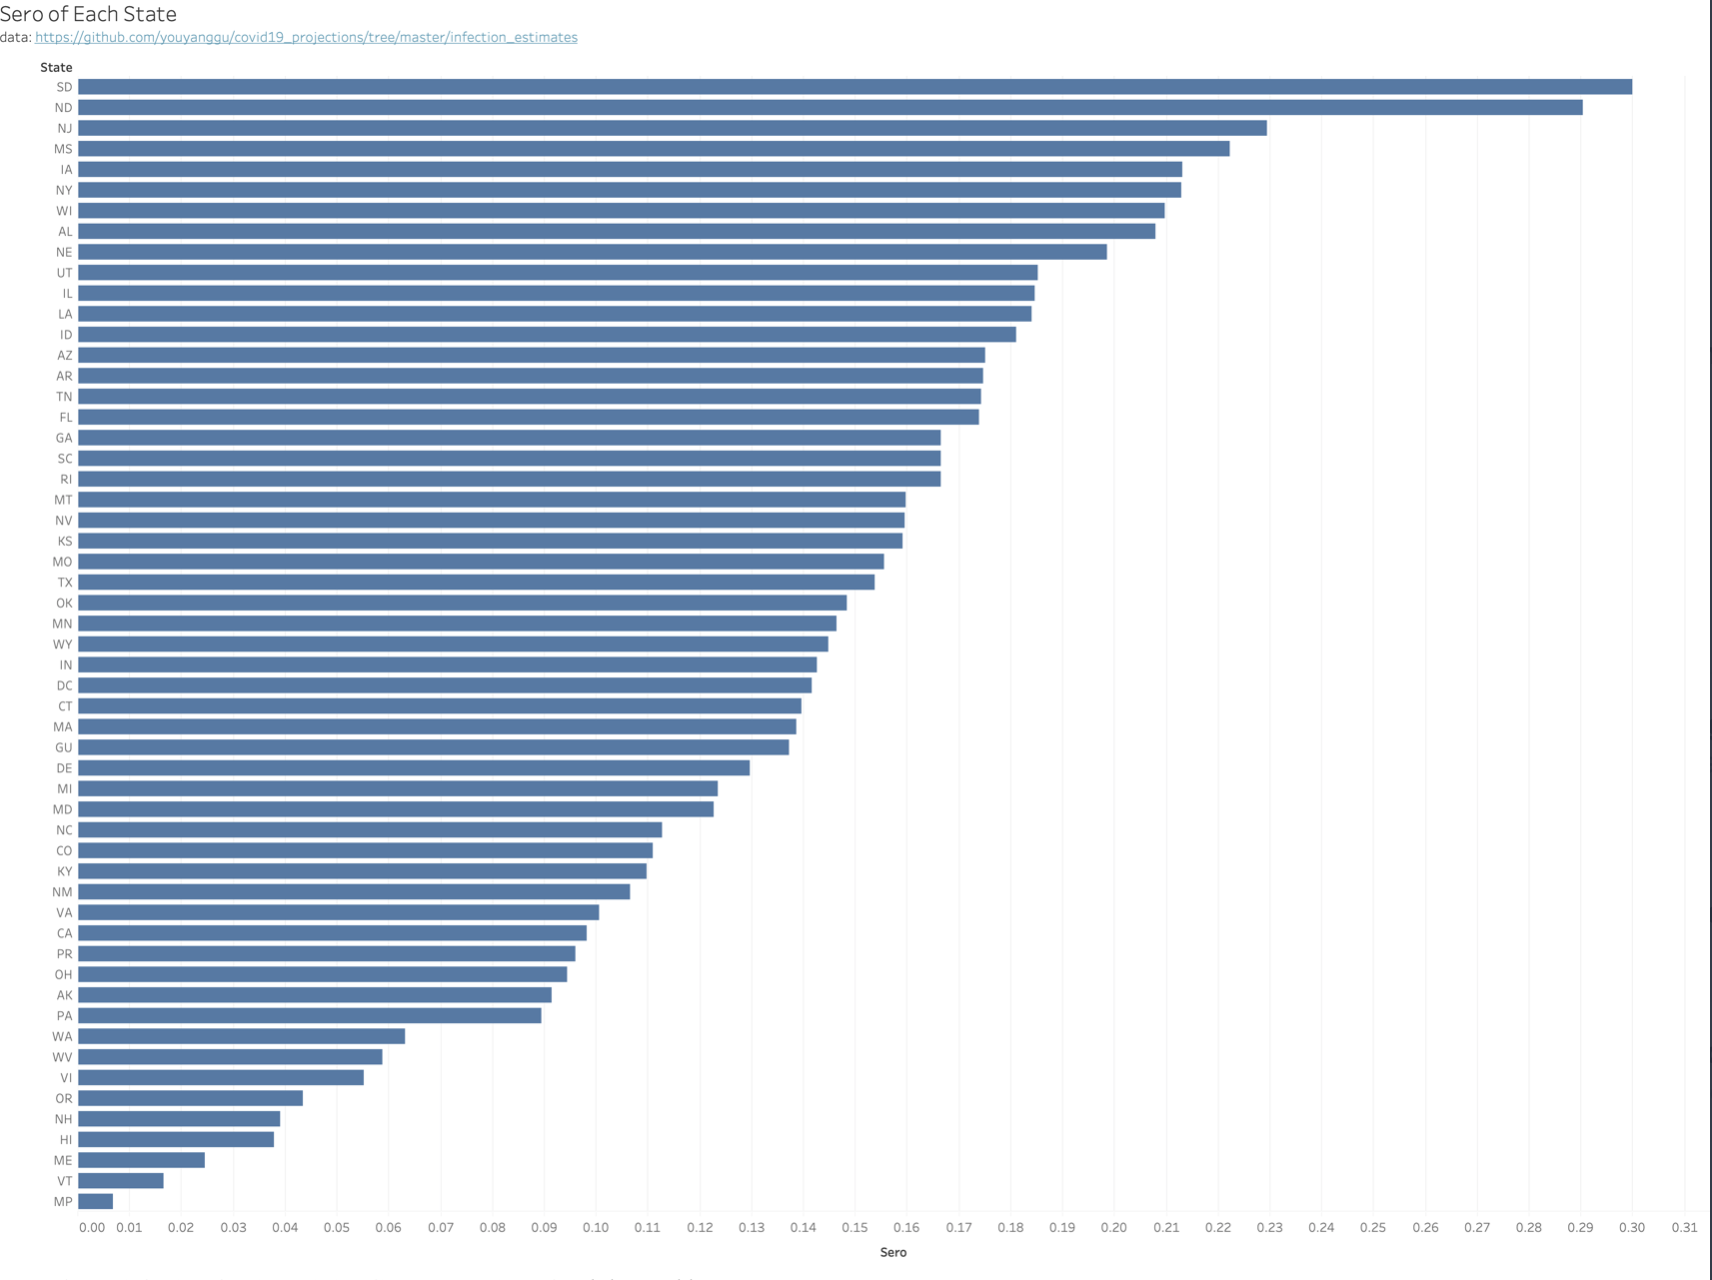
This chart was done by Youyang Gu, who does great analytical work on the epidemic and can be found on Twitter, contains his estimates of the current seroprevalence or actual total infected people in each state. He has an algorithm that he uses to estimate this. Note that for Minnesota he is estimating around 14%. Wisconsin has a much higher estimate of 21%. And look at the Dakotas up there at the top. I try to avoid predicting because I really have no idea about the actual impact of population immunity, contact patterns and pre-existing immune protection on the epidemic. But I believe transmission has to be slowing substantially in those largely rural states and I wouldn’t be surprised that they have peaked and will begin to fall. Minnesota is likely only a week or so behind. You look at the curves and it is clear that interventions don’t make much difference. For whatever reason, when CV-19 gets going, it just ramps up incredibly fast, runs out of steam in a few weeks and plummets down to a long tail til the next surge. This is a highly, highly transmissible pathogen and I really believe the infectious dose, especially for anyone who is vulnerable, is very low. And why it slows, I don’t know either. Fewer targets obviously; attacking the most vulnerable with visible disease first; behavior changes, all likely play some role.
In any event if that 14% or so number is right for Minnesota, we have had about 800,000 cases, or over three times the current reported total cases of 257,000. That would be down quite a bit from the one in ten cases the state and the CDC were telling us were detected in the spring. I suspect it is close, I can’t imagine that we are missing 90% of cases with the testing levels we currently have. Helps me think about how to “normalize” cases for testing over the course of the epidemic as well. Could do a sliding scale over time going from ten times reported cases in the spring to three now.

Love your posts! I’m a Minnesota transplant to Arizona but still love my home state. and follow news from MN closely. Your posts have been incredible, and should be required reading for State Health Officials (not so much Gov. Walz – don’t believe he would understand). KEEP UP YOUR GREAT WORK!
I like your explanation, or at least description, of why C19 peaks and then quickly falls again, regardless of mitigation measures. I’ve been looking at the stats out of Europe, and it sure looks like they’ve been dropping rapidly after lock downs were re-implemented. So, if you’re right, that is coincidental, and they were bound to drop regardless.
Right now looks like SD is trending down.. Hope it stays that way! https://doh.sd.gov/news/Coronavirus.aspx (Click on the Trends Tab at top)
I think SD’s website on COVID isn’t too bad. They periodically add new data.
Interesting that New Jersey has a seroprevalence right up to the Dakotas while Connecticut is more like Minnesota. Both NJ and CT were part of the initial NYC spike driven by commuters in and out of New York. It must be that a far greater fraction of the NJ population either commutes or is in close proximity to NYC and commuters. In CT the infection followed the rail lines for the most part and areas outside of there were spared until the second spike.