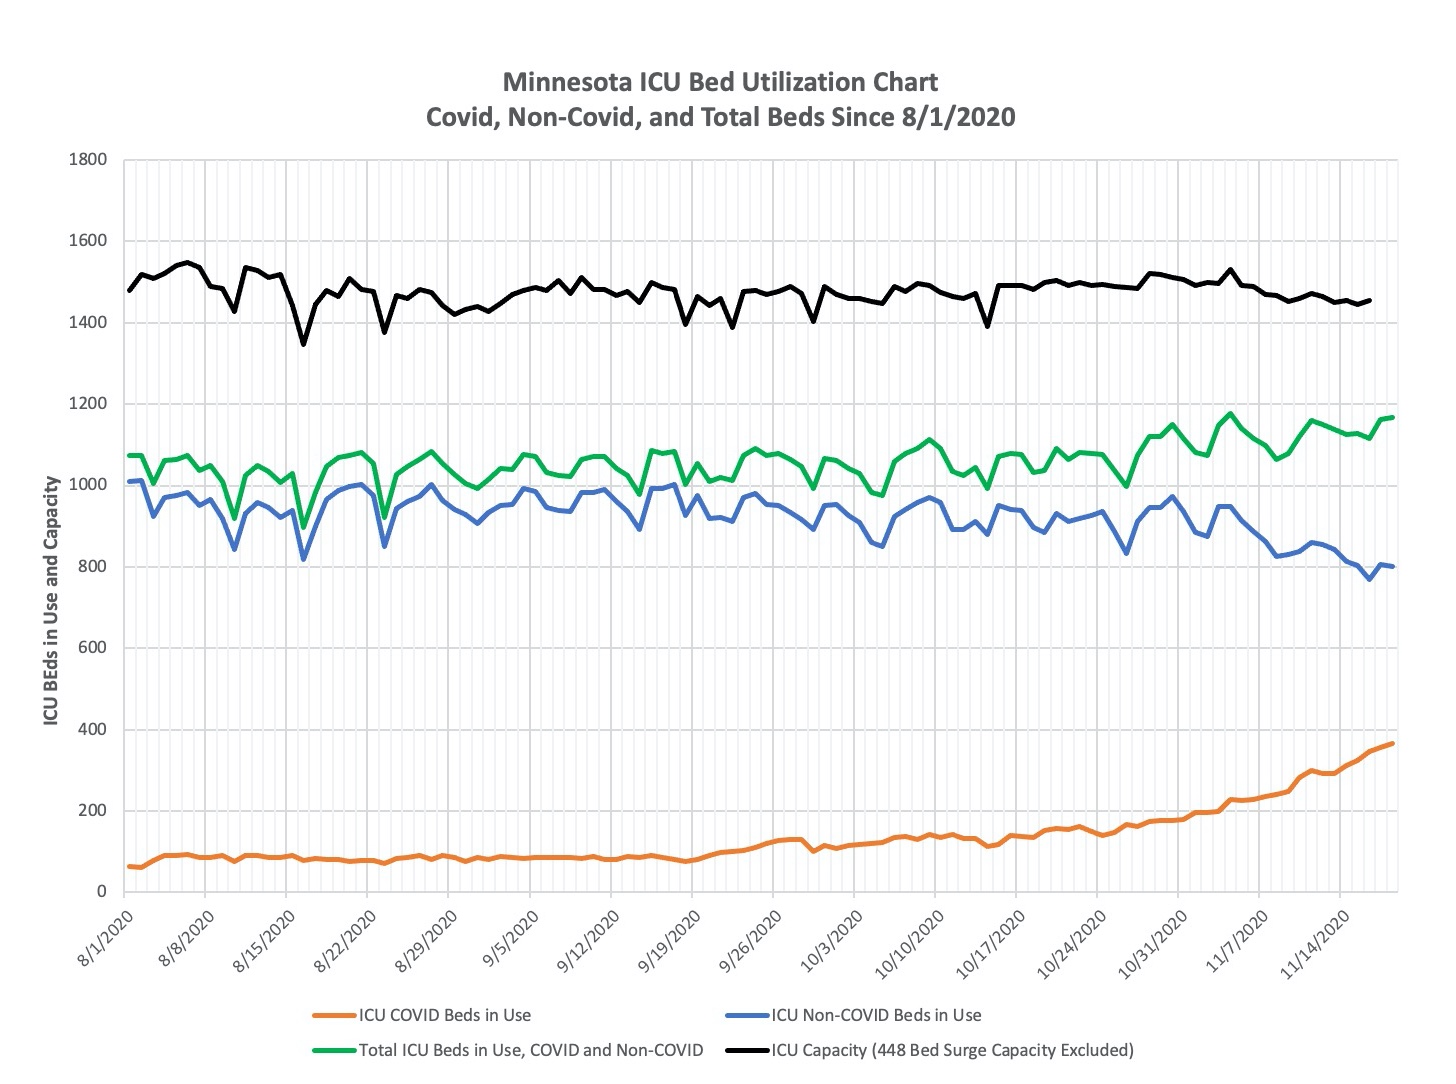
Thank you to DD for the charts. He has done a great job of tracking and charting the use of general hospital and ICU beds and you can see that here, pretty much up to date. Notice that in the last few weeks there is a shift to CV-19 use. We still need far better data from the state on length of stay, use of observation stays, remdesivir use, CV-19 as the actual reason for the admission, and hospital-acquired infections. And while beds and other resources are important, it is definitely true that staff availability is even more critical, so the level of infections among health care workers is also important to follow.

How does this year’s hospital usage chart compare to prior years? I this year radically higher or are we simply seeing the seasonal upswing in respiratory illness admissions that comes every Fall? Is Covid a significant multiplier or a convenient scapegoat?