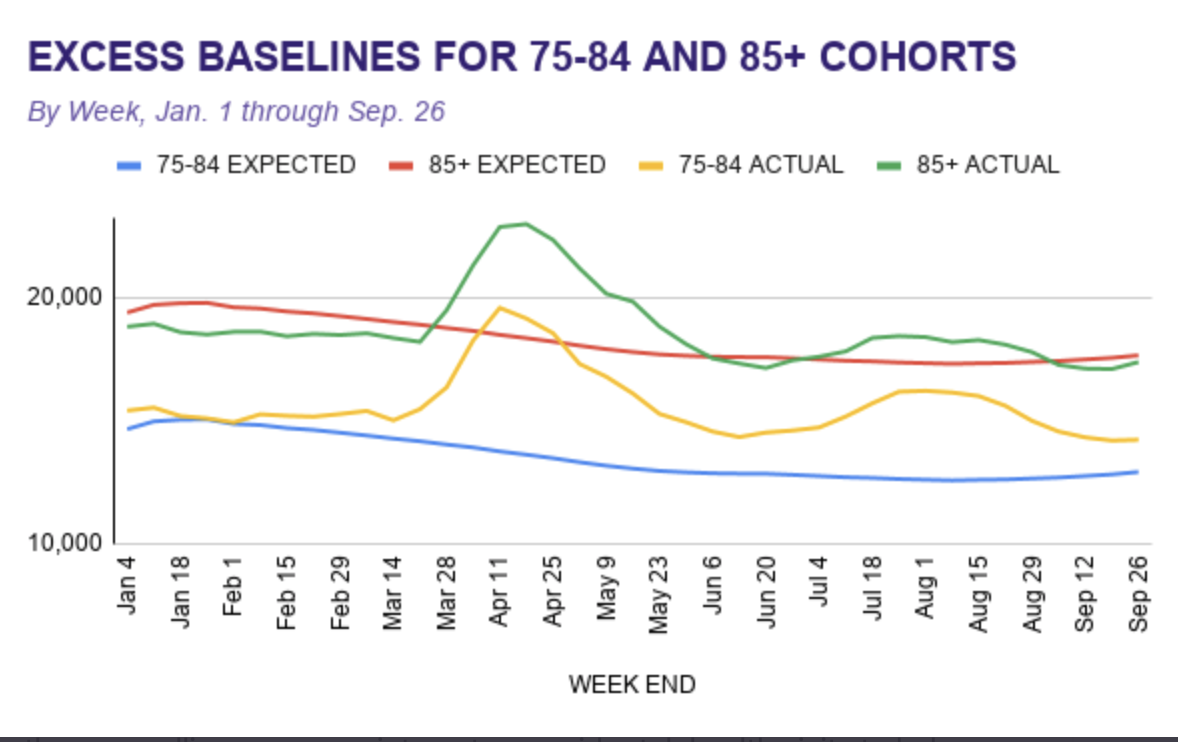
Thanks to Kyle Lamb for this very revealing chart. It shows the average of deaths in the past few years among 2 age groups, including the 85 and over cohort. It also shows the 2020 deaths in these groups. You see the bump up, but you also see in that 85 plus group how the line has begun to dip under the average. As in Minnesota, the deaths in this group attributed to CV-19 are deaths that would have occurred in the near future anyway, and been attributed to some other cause–heart failure, acute kidney failure, dementia, and influenza. We are likely beginning to deplete the pool of very vulnerable among that group. We can expect to see the same trend among the 75-84 cohort in the next few weeks or months.

I concur completely. Both of my 87 year old parents died either just prior to COVID or during it. They died from reasons unrelated to COVID-19, but both were frail with many serious health issues. Any kind of event such as flu or simply disease progression would have been fatal. Some of the worst things that happened to my mother who was in a nursing home with Alzheimer’s was a lack of contact with family in the last days. The old saying that pneumonia was “an old mans best friend” is still true at it’s core. In treating people solely as targets or hosts for the virus we forgot the human factors. This seems to be a serious shortcoming of public health specialists. Perhaps a rotational stint in primary care might be a required continuing education for the Dr. Fauci’s of the world.