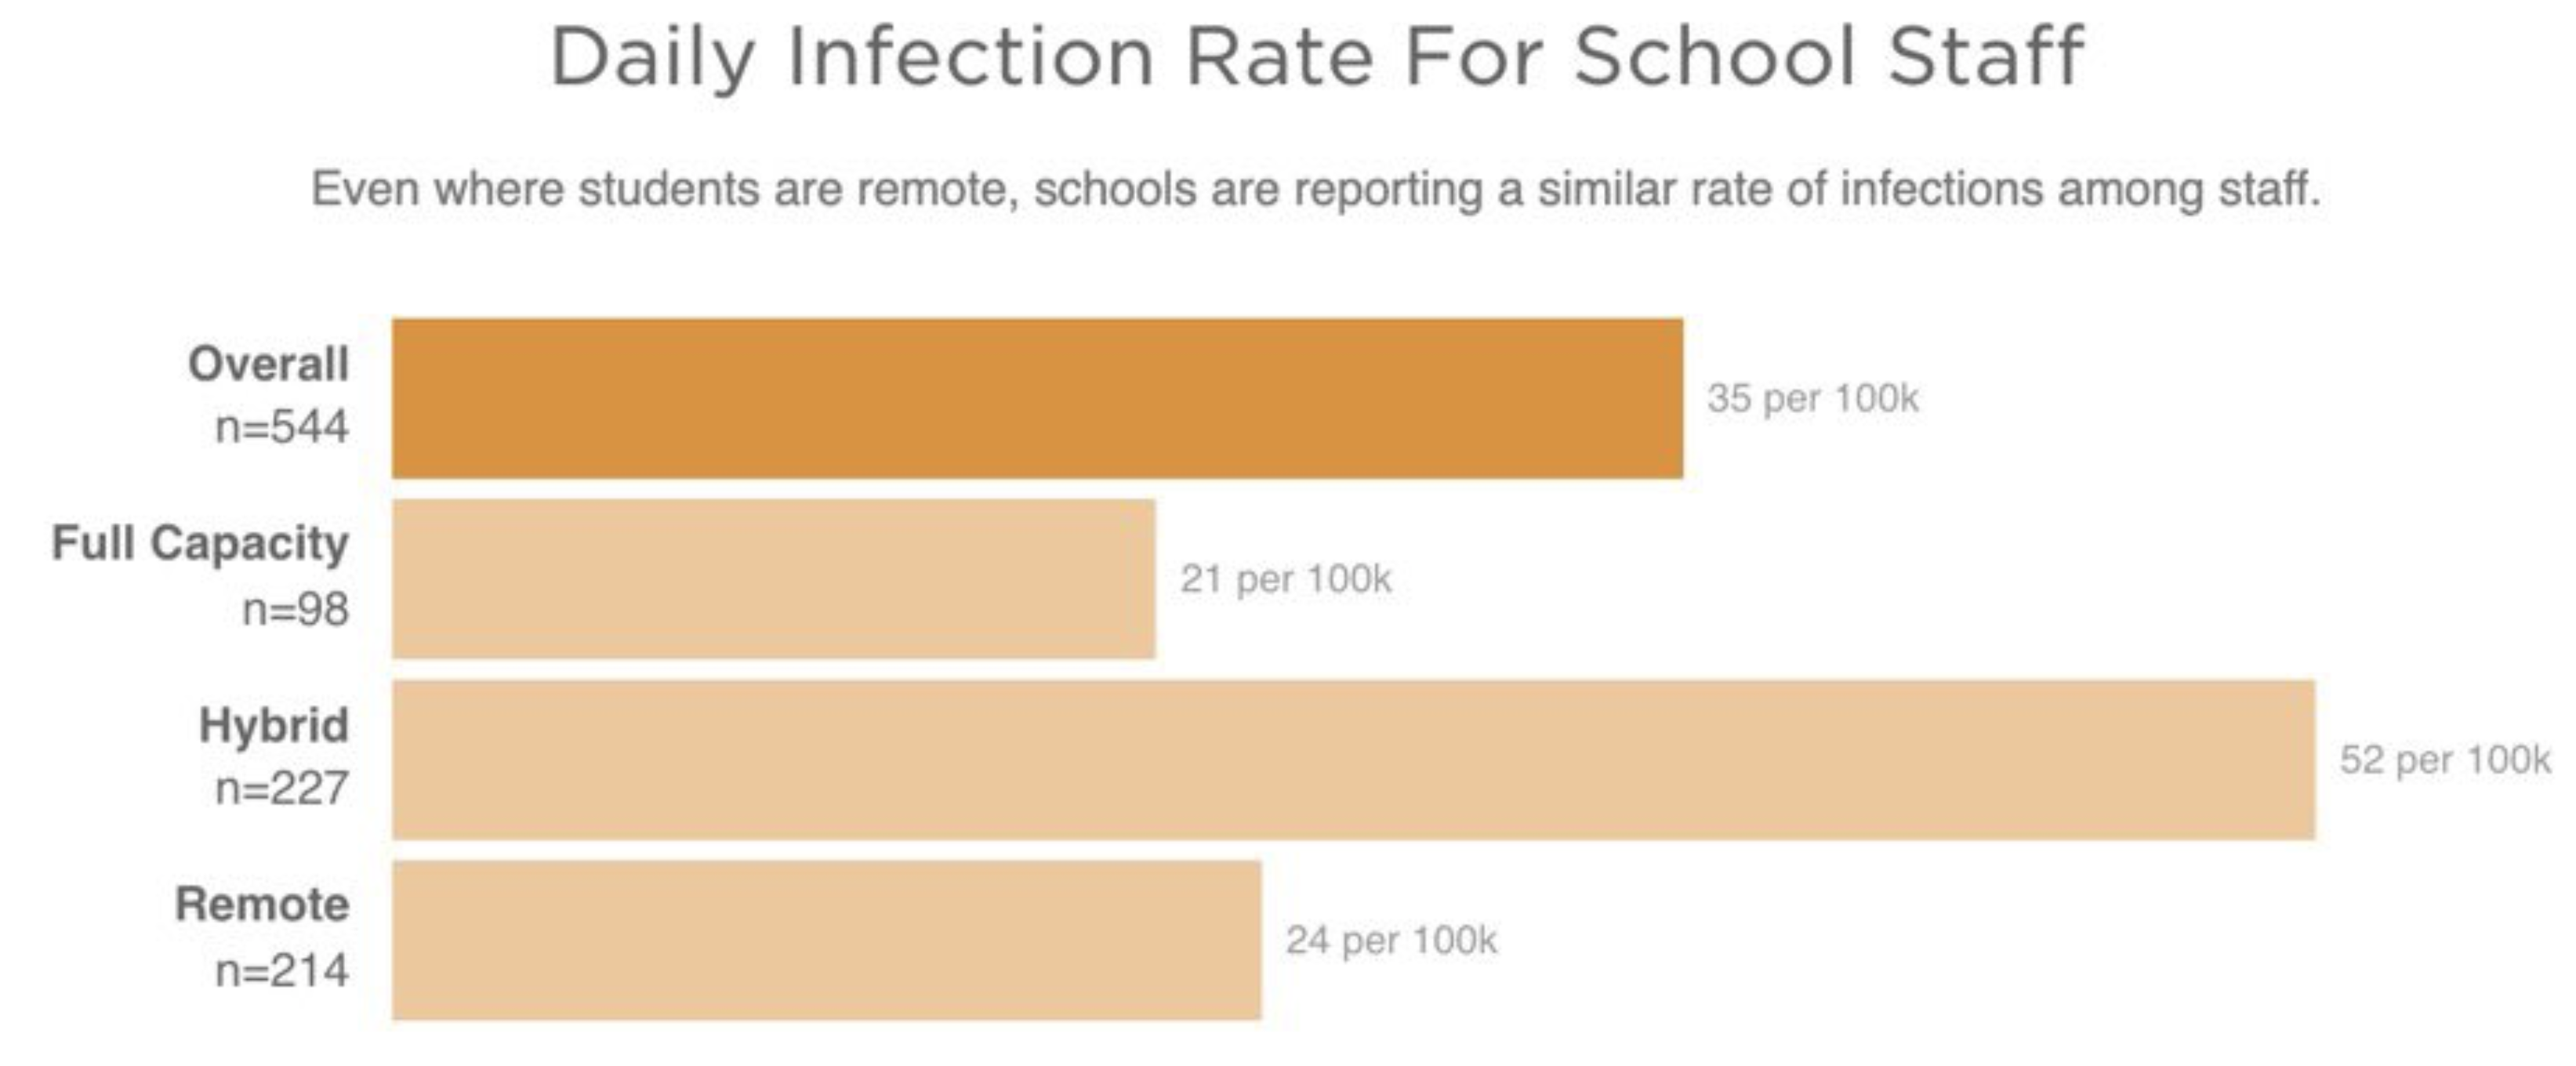
This is a chart that was put together based on cases reported for various types of schooling. Thanks to Twitter. You can see that in-person has the lowest rate, closely followed by remote, and hybrid is the worst, which makes sense. I don’t know how anyone looks at these statistics and concludes that given the worthlessness of remote learning, there shouldn’t be full in-person learning. What are we doing to our children?

More and more people are making a similar observation: Education Minnesota appears to be busy at work protecting their members from working too hard. And the Blowhard is a willing accomplice, a “useful idiot” as Lenin would describe.
So, to your question, why isn’t their full-time classroom education? The teachers don’t want it, they like “working” from home! In this case, although the BLM signs say, “Science is real” and the Blowhard says he is “data-driven”, it doesn’t fit their agenda.
We are going to look back later and say we watched in 2020 when the public education system blew itself up.
(Off subject, did you see this? Young mom in Logan, Ohio arrested for not wearing mask at middle school football game. She was social distancing and sitting iwth people wearing masks. The cheerleaders weren’t wearing masks. The football players weren’t wearing masks. The arresting officer was not wearing a mask. https://www.brighteon.com/e3fb5d06-2dd3-4055-a6fd-8b7c98737ee0
Hmmm, we arrest people for not wearing masks sitting with few people around in the outdoors, but we can’t seem to stop people from burning our cities.
Is this data from Minnesota schools only?
across the country, but not clear that it is every jurisdiction