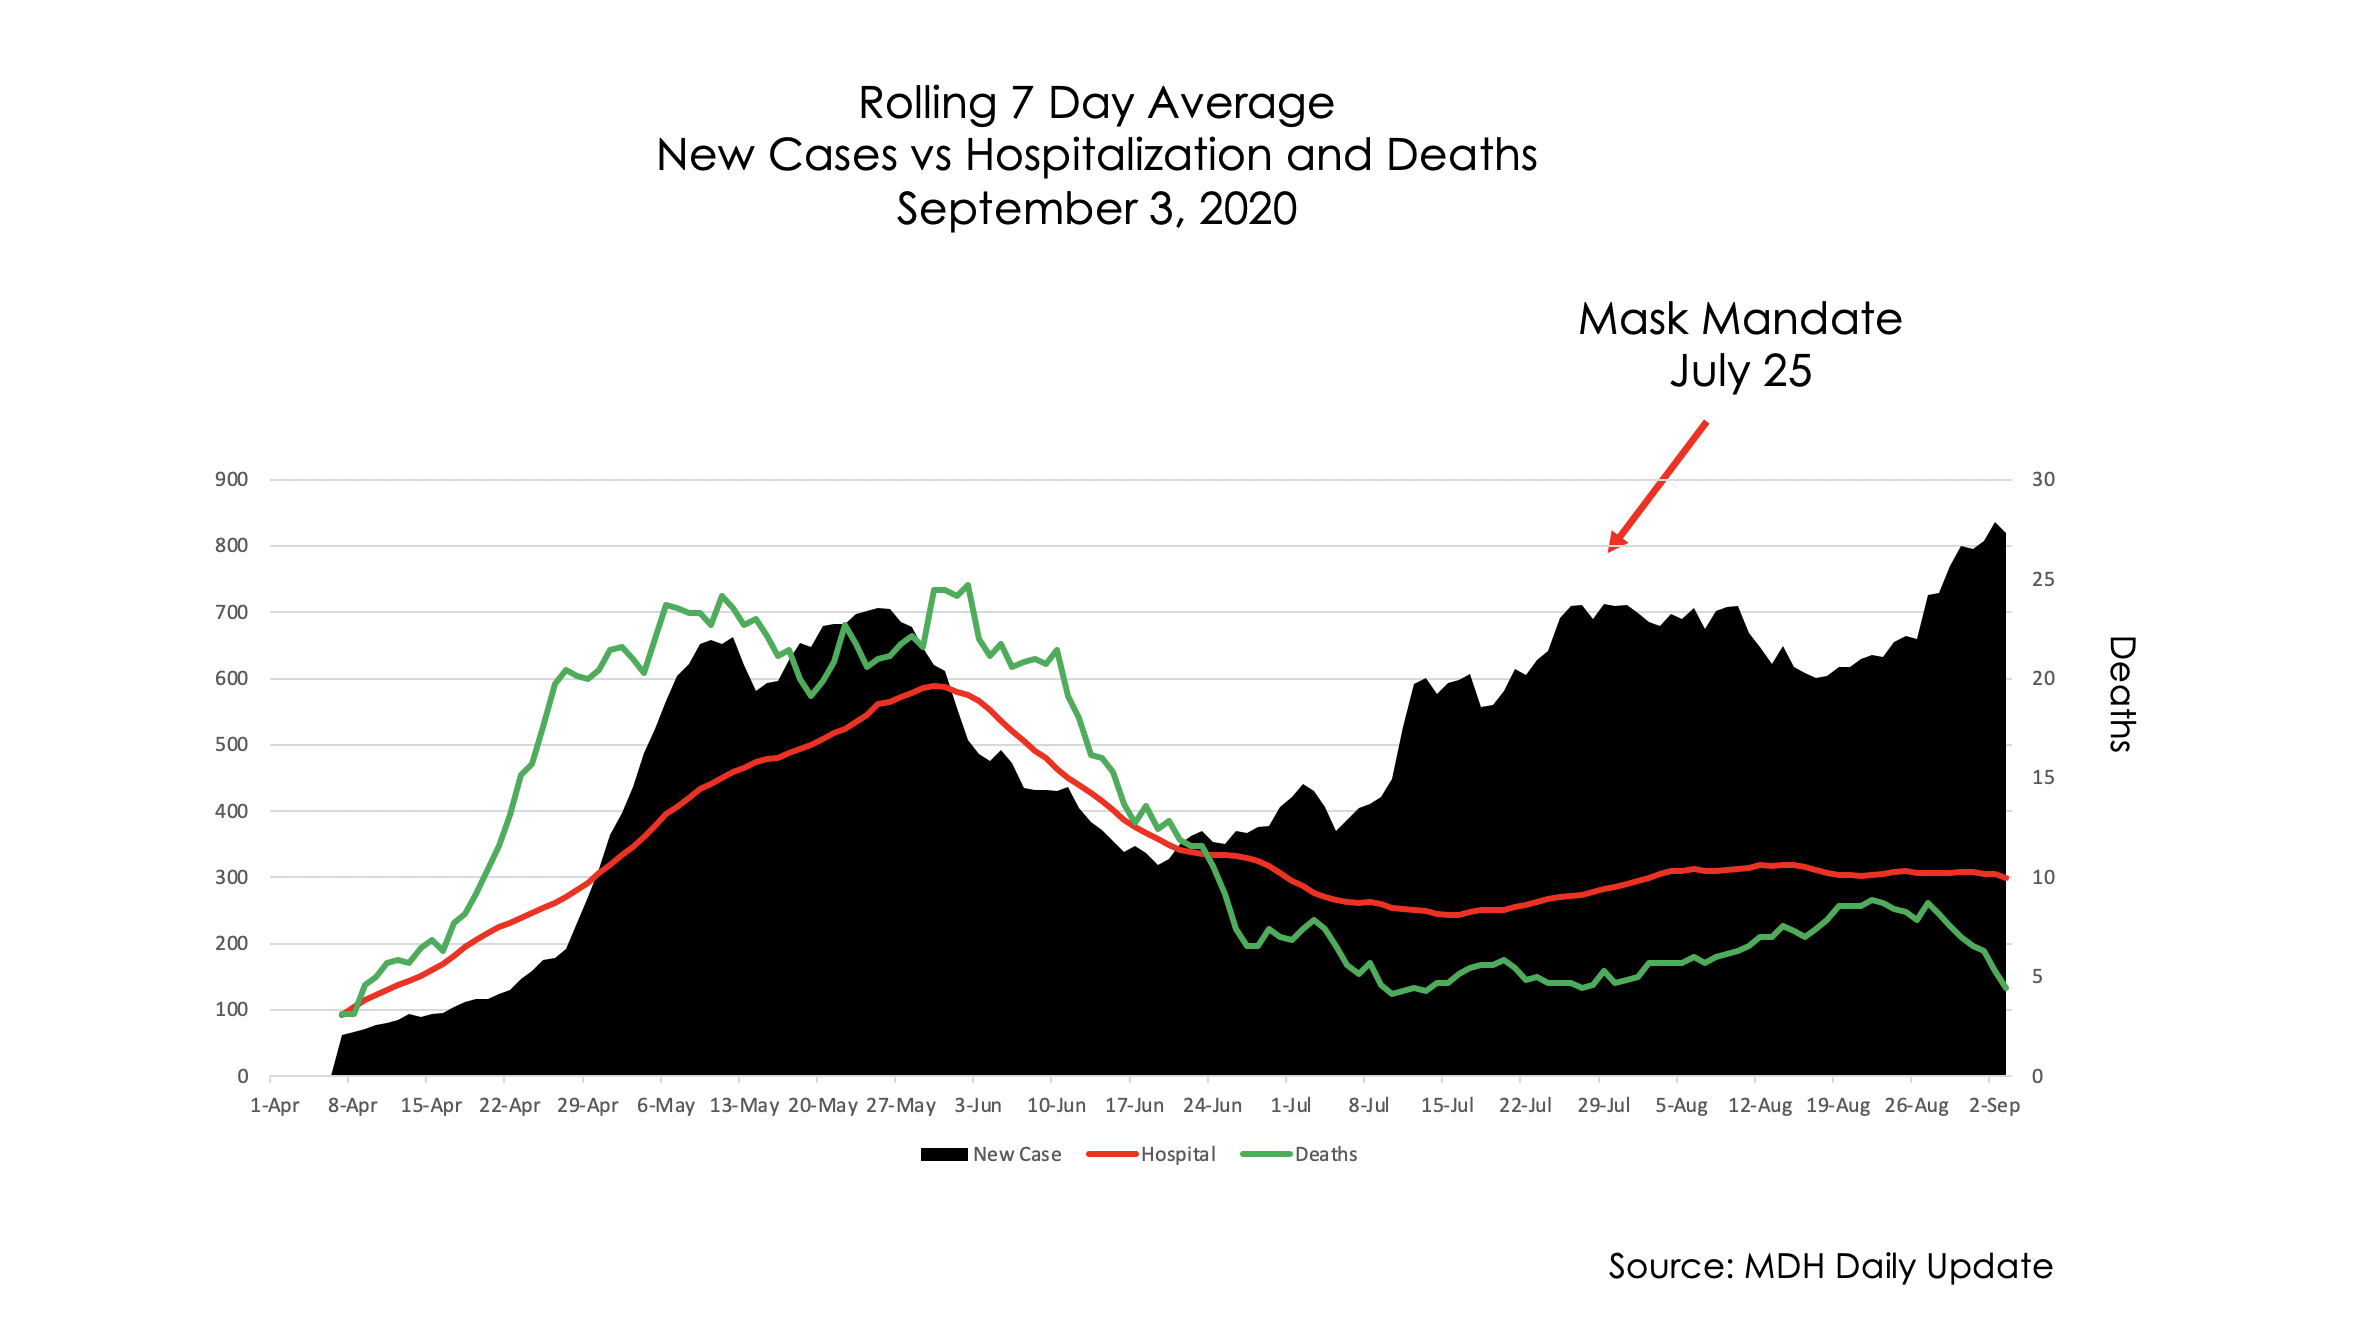
Here is an updated chart, thank you again to C. Nelson, of the rolling 7 day average of cases, hospitalizations and deaths in Minnesota. These are based on date of report, so actual date of occurrence may be a little different. You can see clearly that cases continue to have low levels of severity, as hospitalizations remain very steady. This chart gives you a sense of how much that mask mandate has reduced cases. Looks like every other chart on mask mandates–no effect.

The idiocy is unbearable. I made the mistake of tuning into the yesterday’s presser on concern that new edicts would be declared… luckily not. Instead had to suffer the scolding backed by lies yet again. I can’t wait for your post covering it. This graphic though directly contradicts so much of what they said, including their answer to Tom Hauser’s question… the truly depressing part of it though is seeing how many people will pick up and parrot the blowhard’s talking points verbatim. Everything Gatto warned us about with public schools seems to be bearing out…
If it were possible to add the line of Minnesota’s population above the case/hospitalization/death lines without making the graph so small as to be ineffective, the folly of the policies would be patent. BTW what have you gathered about the latest issue de jour of “post-Covid syndrome” which looks to be coming the newest tool of terror of our political masters?
Thanks for another good one. Appreciate the comments of others too.