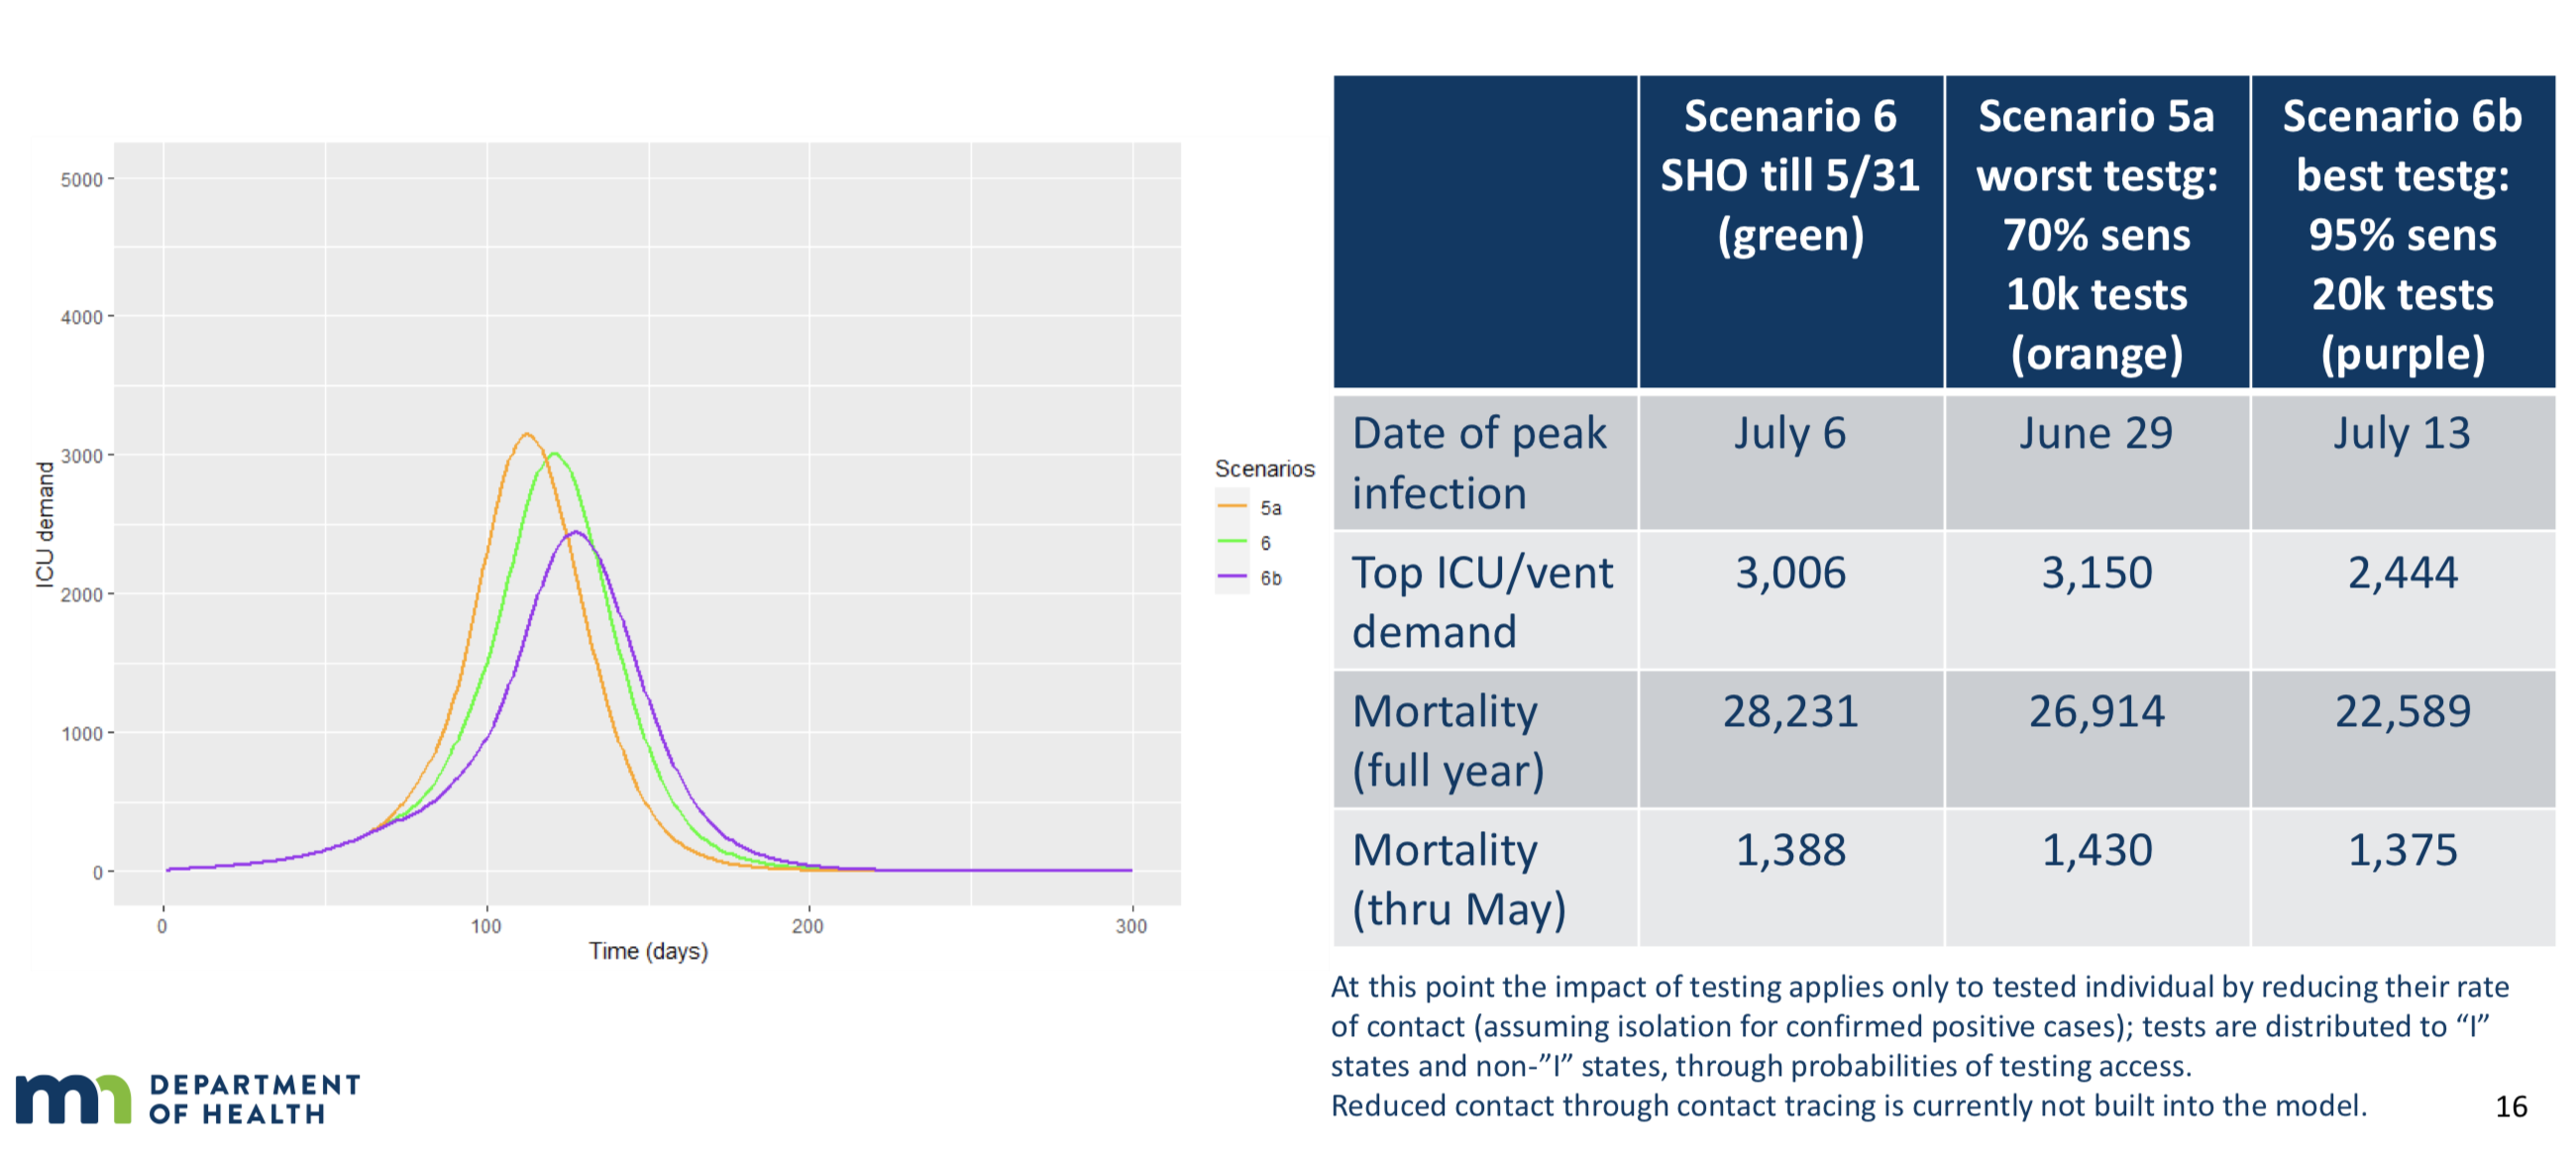
I mentioned this a couple of days ago, but I thought you might like to see it. Here is version 3 of the model’s output and predictions for the scenarios we were operating under. It has been a while, so I will again remind everyone that the level of reduction of contacts assumed in the model in these scenarios did not occur, so according to the model, the number of cases and deaths should have been even worse. These slides are directly from the presentation given by the state in introducing its updated model. The first slide shows projected ICU demand, which we never even got to a tenth of what the model predicted, but more importantly gives you the table with the forecast for the scenarios most like what we operated under. Day 1 for the model is March 22nd, so day 100 is July 1 and day 200 is October 8.
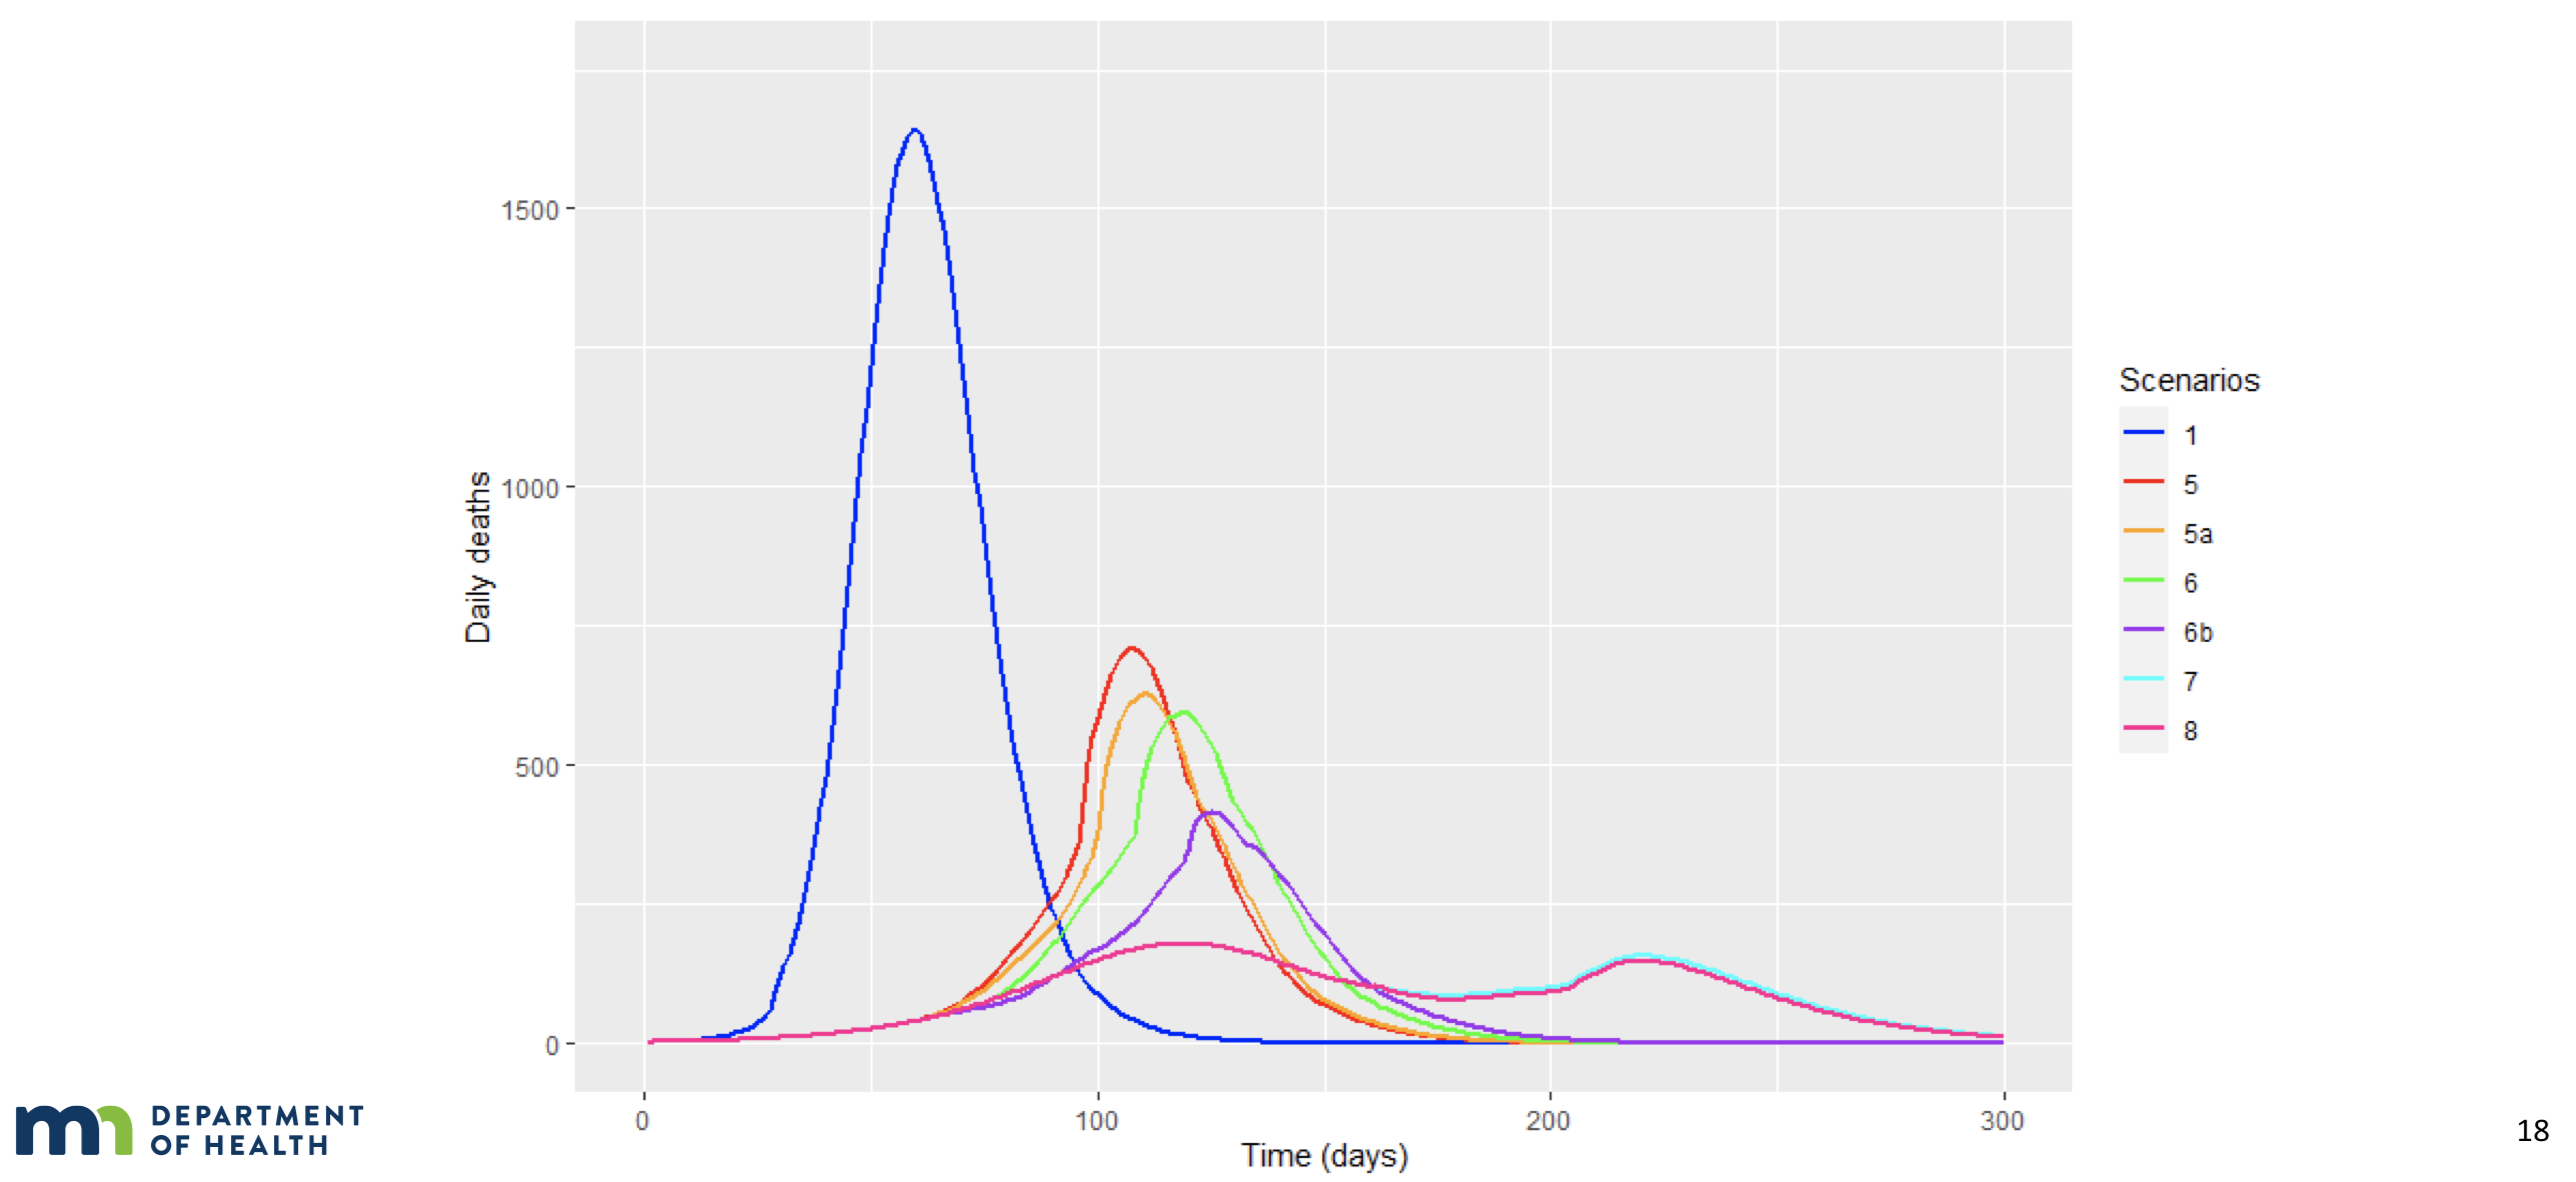
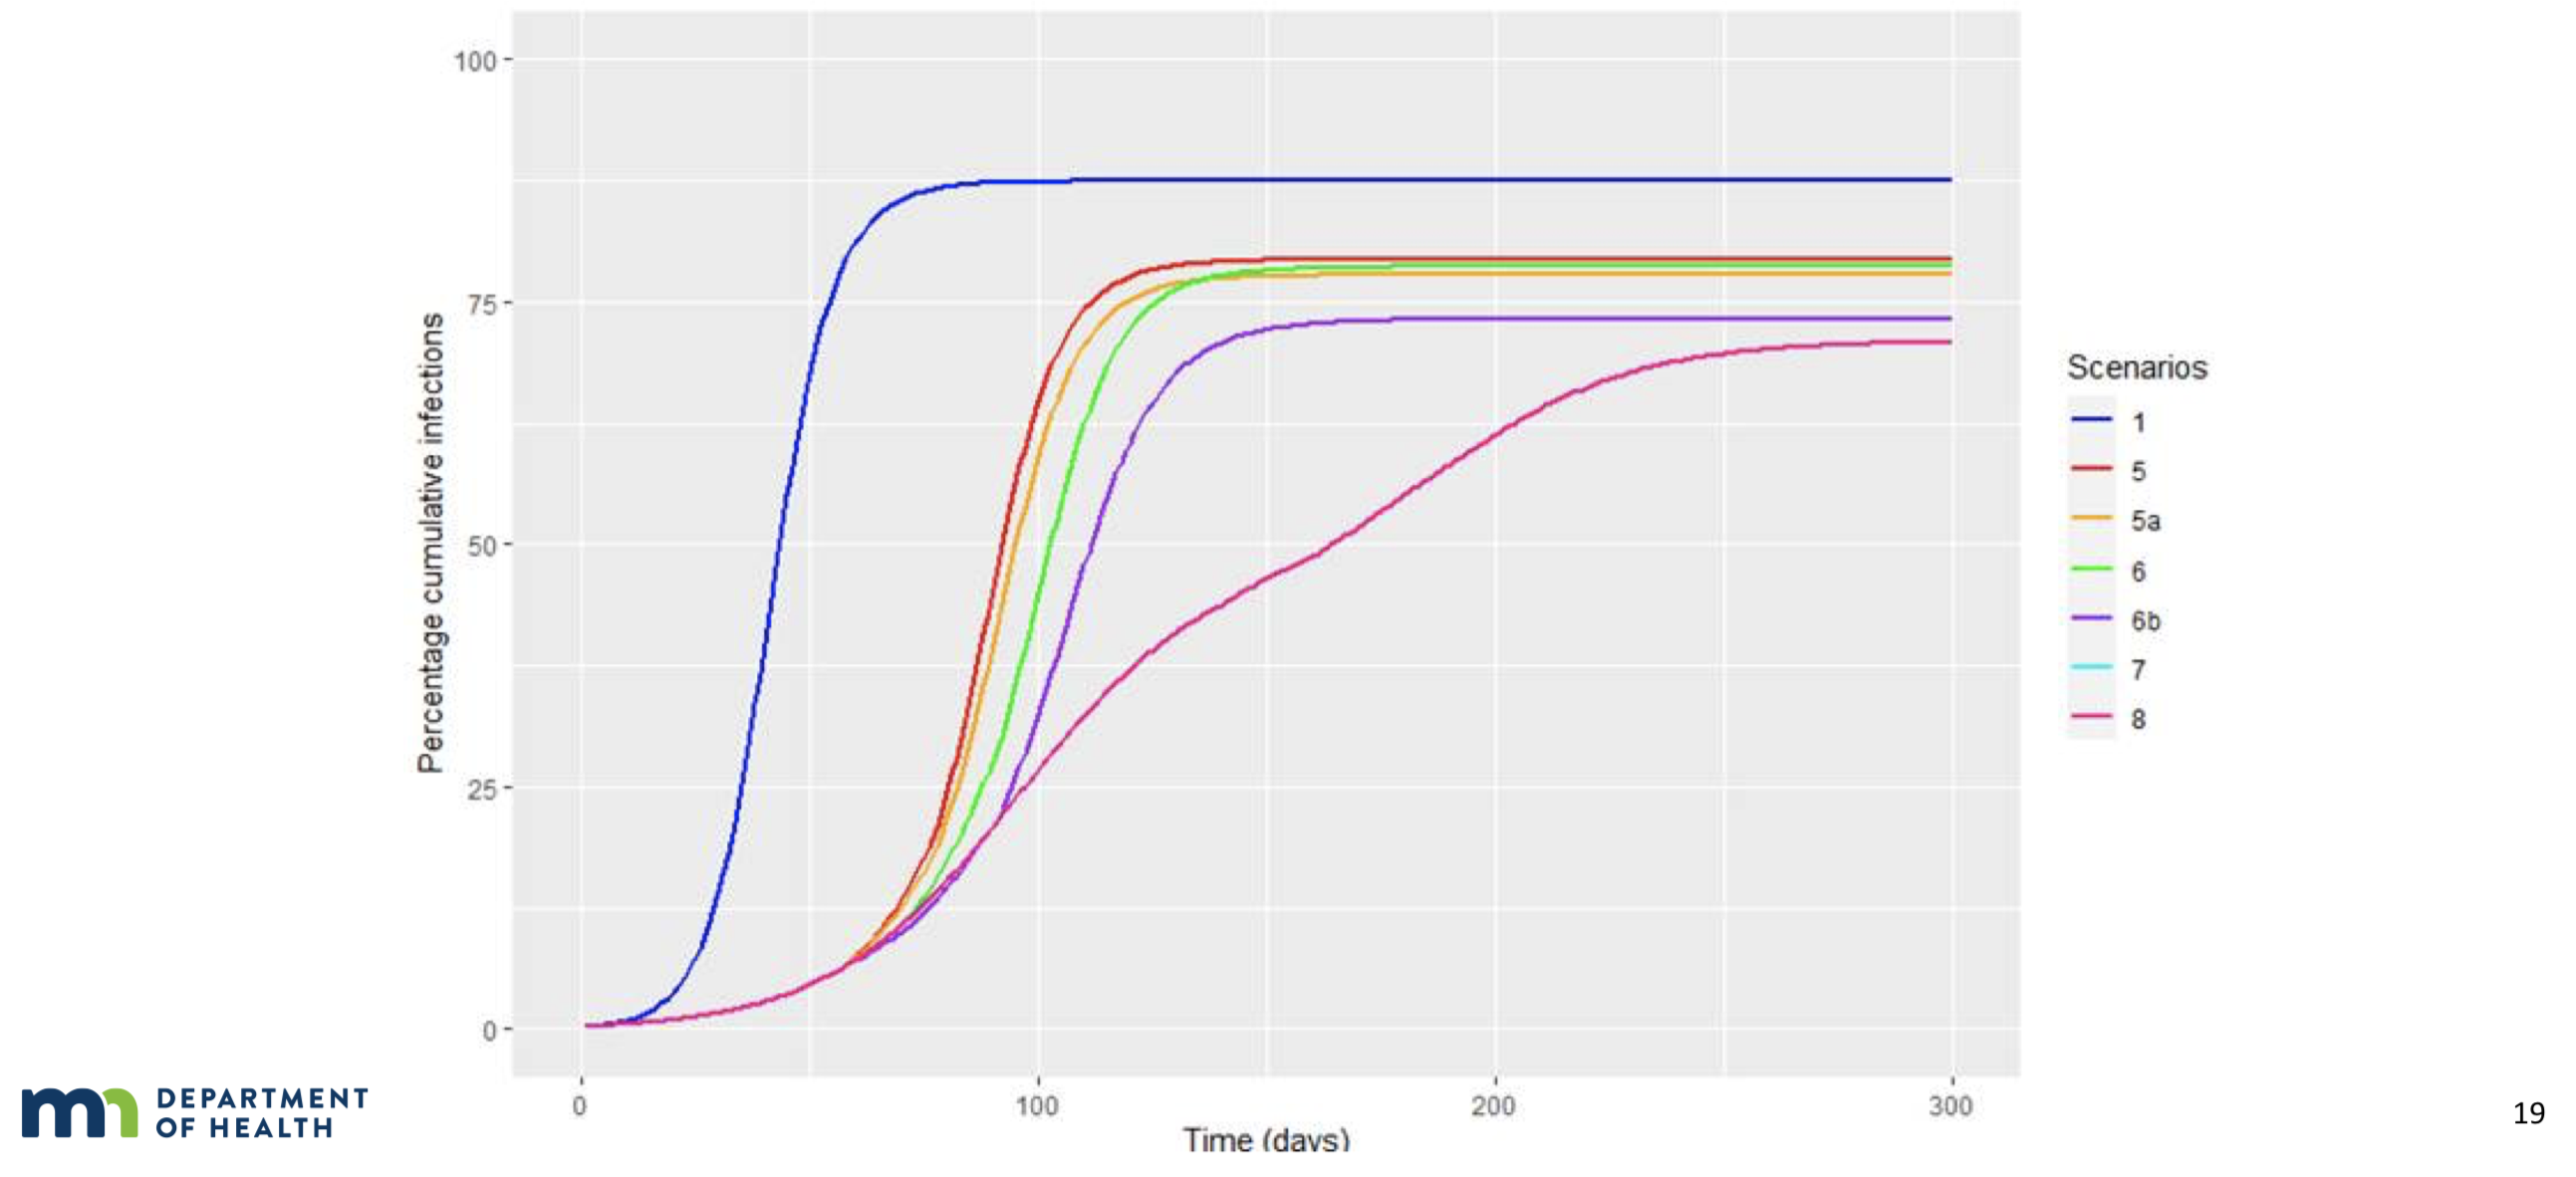
According to the model, the epidemic peaked in early July and we are in the runout tail with a very low residual level of infections. The slides speak for themselves, but slide 2 is daily deaths, not cumulative, and you can see that the scenarios we operated on were predicting 500 or more daily deaths. We have never had a single week with even 200 deaths. Slide 3 shows the cumulative rate of infection, and again, the forecast was at least 70% of the population infected by now, or 4 million Minnesotans. I am not sure, but I think the actual number might have been a bit lower than that.
These forecasts, which were the only thing relied upon the Incompetent Blowhard in issuing his lockdown orders, weren’t just slightly off. What actually occurred isn’t even in the model’s ranges of uncertainty. They were off by over tenfold. How can you even pretend that you had the slightest clue of what the epidemic would look like when you were so far off the mark. Why were they so wrong? Every assumption they made was erroneous. Bad parameters for hospitalization and death rates, bad assumptions about percent of asymptomatic cases, about the uniformity of susceptibility and infectiousness, and reliance on known-to-be bad China data and other poor models. And it isn’t like they weren’t warned of the errors. I and others by the time this version was released had pointed out serious defects, I repeatedly offered to meet with the modeling team to discuss a better approach. They ignored all this helpful advice.
Criticizing this model isn’t fair sport, it is like shooting a deer tied to a tree five feet from you, and using a bazooka. But the state is responsible for producing it and relying on it. Think we will get an apology or even an explanation from the state?

Your metaphor about shooting a deer made me think of the next future crisis Jan and Kris will be worried about.
Outstate Minnesotans tromping around in the woods, gathering in cabins or small town taverns at night to swap stories and enjoy the company of friends. The spike from those activities will shatter the Sturgis-effect and likely be catastrophic.
Get ready!