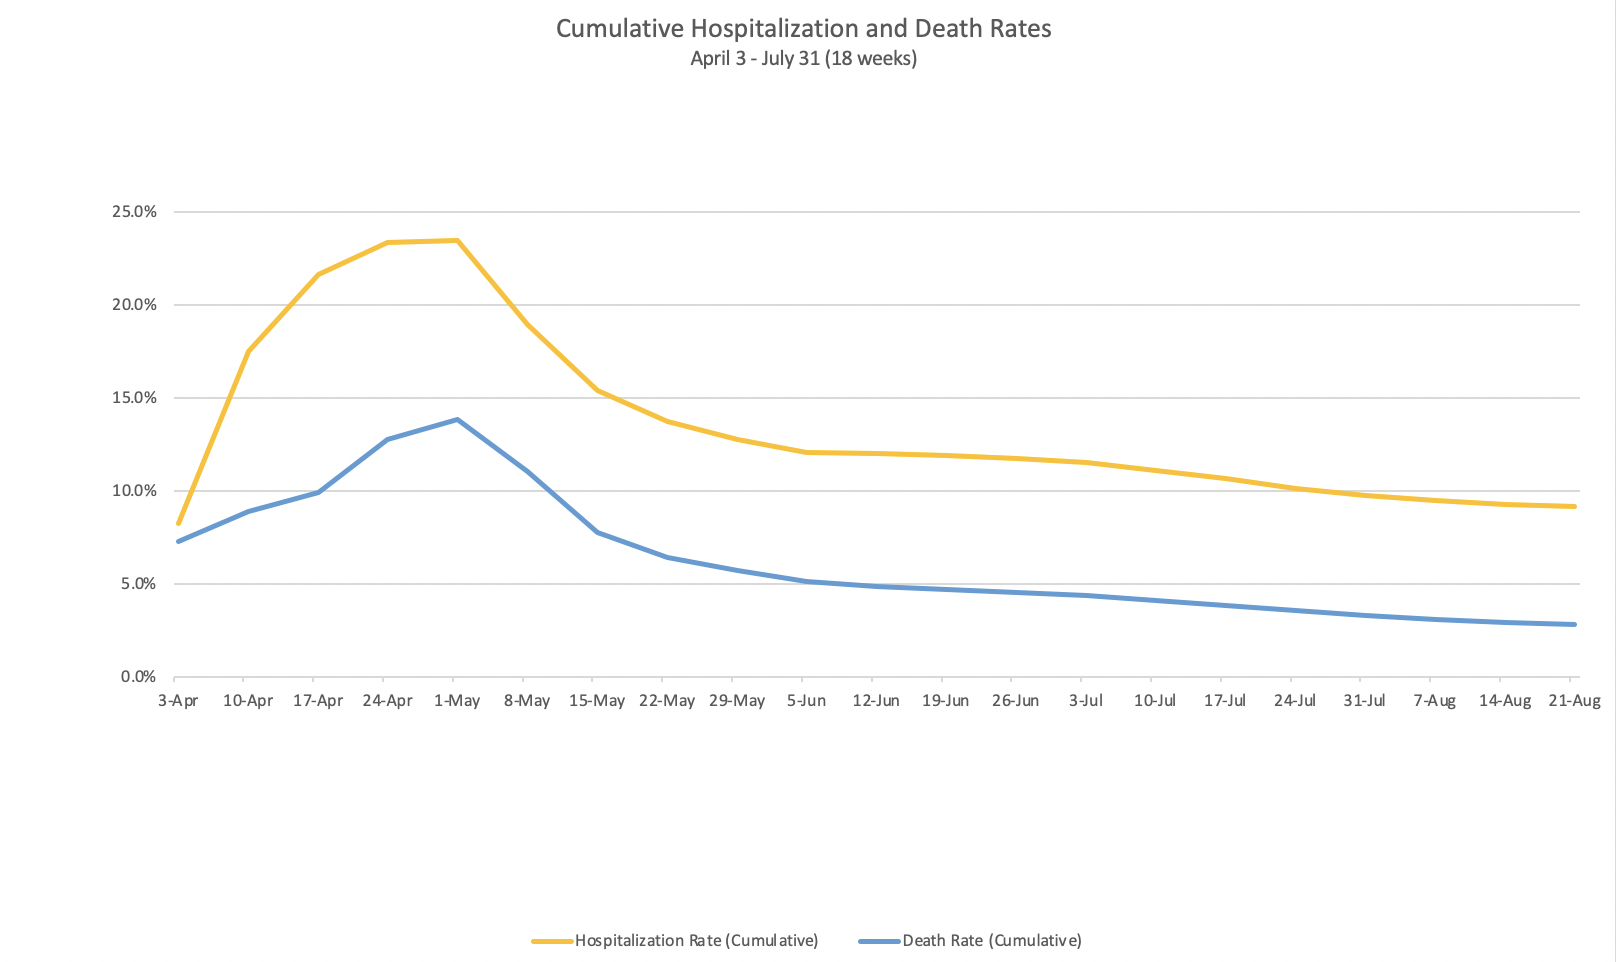
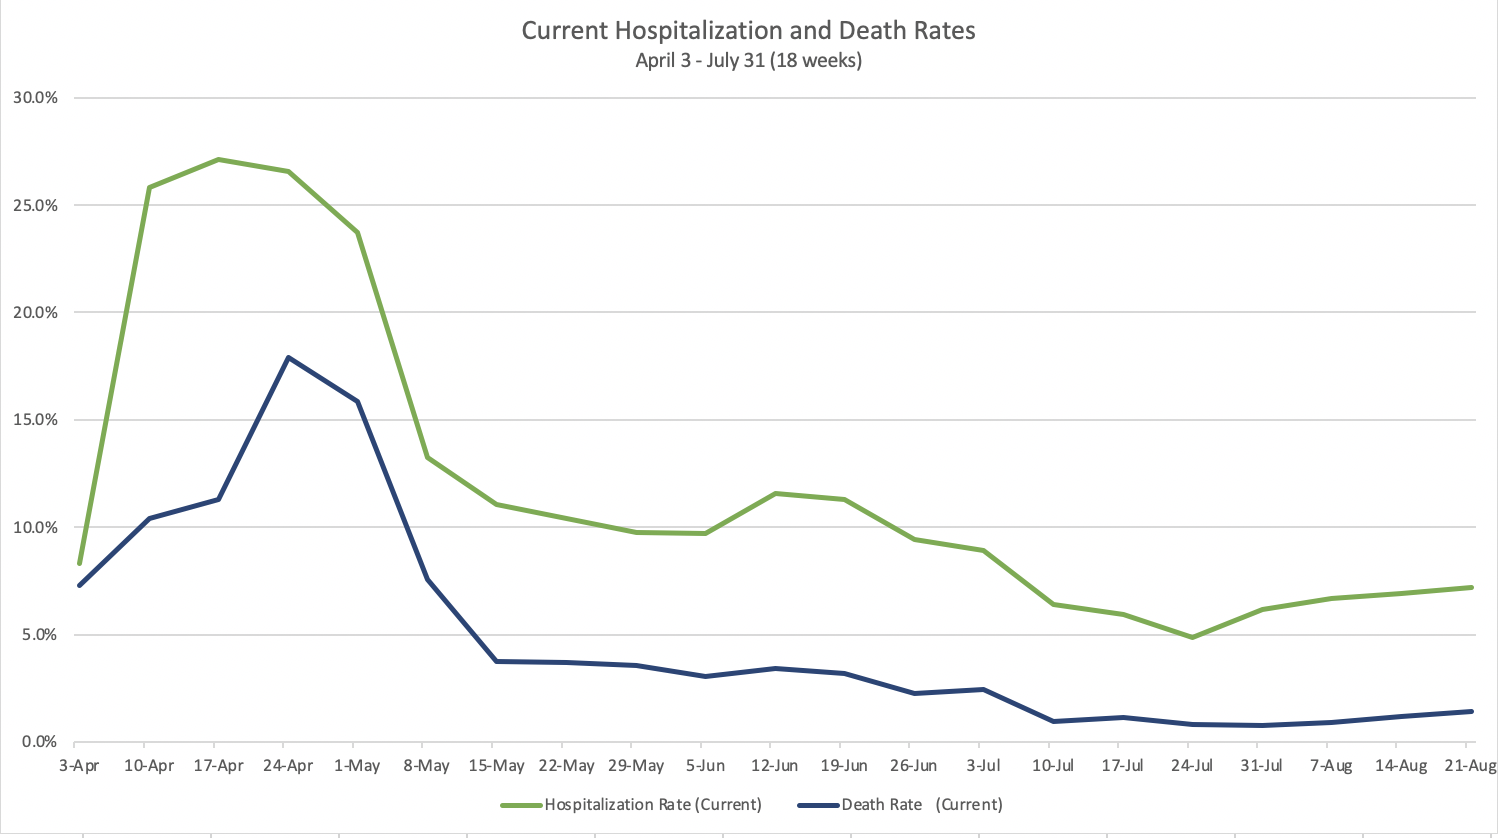
You will recall a few weeks ago I created this chart and table that show trends in case rates of hospitalizations and deaths. The idea was to try to create a “cohort” look at a group of cases arising in the same time frame. Leaving aside data issues, what this does is take deaths as reported by Minnesota for a certain week, take cases from the week ending 14 days earlier, which is the median time to death according to the CDC and take hospitalizations from 10 days earlier, which is the median time from hospitalization to death. The analysis shows for cases in a particular week, what percent ended up in the hospital and what percent died. I show this both cumulatively since the start of the epidemic up to the latest week of deaths, and just looking at the current week’s numbers and percents.
In the cumulative chart you see that continuing long tail down to the right that indicates that overall the death and hospitalization rates are continuing to decline. If I had cumulative cases on here, you would see them as an increase in the early part of the epidemic, a decline when the real epidemic was over, and then another increase over the last 8 weeks or so that reflects testing growth. In the current chart, you see the slight tick up in hospitalization and death rates in recent weeks. But in terms of deaths, what it really reflects is two death dumps by the state in the last two weeks. Most of those deaths were actually in earlier weeks; you will recall my saying that 15 deaths have been added in April and 17 in May. The next iteration I do of this chart, I am going to create a version that uses the CDC data, which is week of actual death. That will show a change in the current week graph, instead of the uptick, you will see a flattening. I wish I had hospital data for actual day’s census as well, but with Minnesota, you have to take what you can get. Thanks again to Lisa Jansa and one of my daughters for helping with this.
| Week | Report Date (Week Ending) | Deaths | Hospitalizations (10 days earlier) | Cases (14 days earlier) | Hospitalization Rate (Cumulative) | Death Rate (Cumulative) | Hospitalization Rate (Current) | Death Rate (Current) |
|---|---|---|---|---|---|---|---|---|
| 1 | 3-Apr | 22 | 25 | 303 | 8.3% | 7.3% | 8.3% | 7.30% |
| 2 | 10-Apr | 57 | 112 | 640 | 17.5% | 8.9% | 25.8% | 10.4% |
| 3 | 17-Apr | 111 | 242 | 1119 | 21.6% | 9.9% | 27.1% | 11.3% |
| 4 | 24-Apr | 221 | 405 | 1733 | 23.4% | 12.8% | 26.5% | 17.9% |
| 5 | 1-May | 371 | 629 | 2678 | 23.5% | 13.9% | 23.7% | 15.9% |
| 6 | 8-May | 533 | 912 | 4817 | 18.9% | 11.1% | 13.2% | 7.6% |
| 7 | 15-May | 682 | 1350 | 8780 | 15.4% | 7.8% | 11.1% | 3.8% |
| 8 | 22-May | 841 | 1799 | 13105 | 13.7% | 6.4% | 10.4% | 3.7% |
| 9 | 29-May | 995 | 2221 | 17429 | 12.7% | 5.7% | 9.8% | 3.6% |
| 10 | 5-Jun | 1147 | 2709 | 22451 | 12.1% | 5.1% | 9.7% | 3.0% |
| 11 | 12-Jun | 1272 | 3134 | 26136 | 12.0% | 4.9% | 11.5% | 3.4% |
| 12 | 19-Jun | 1359 | 3441 | 28860 | 11.9% | 4.7% | 11.3% | 3.2% |
| 13 | 26-Jun | 1411 | 3658 | 31168 | 11.7% | 4.5% | 9.4% | 2.3% |
| 14 | 3-Jul | 1466 | 3860 | 33470 | 11.5% | 4.4% | 8.8% | 2.4% |
| 15 | 10-Jul | 1495 | 4054 | 36503 | 11.1% | 4.1% | 6.4% | 1.0% |
| 16 | 17-Jul | 1533 | 4252 | 39854 | 10.7% | 3.8% | 5.9% | 1.1% |
| 17 | 24-Jul | 1566 | 4452 | 43991 | 10.1% | 3.6% | 4.8% | 0.8% |
| 18 | 31-Jul | 1600 | 4723 | 48469 | 9.7% | 3.3% | 6.1% | 0.8% |
| 19 | 7-Aug | 1640 | 5028 | 53018 | 9.5% | 3.1% | 6.7% | 0.9% |
| 20 | 14-Aug | 1693 | 5346 | 57594 | 9.3% | 2.9% | 6.9% | 1.2% |
| 21 | 21-Aug | 1753 | 5661 | 61968 | 9.1% | 2.8% | 7.2% | 1.4% |

I wish you knew someone who could do this for North Carolina. Our idiot governor is almost as bad as yours, although as Southerners, we tend to know our governor is not that bright and ignore a lot of his stupid edicts. He has been sued by numerous news outlets to release state data, but refuses to do so. He also filters out who can ask him questions. Thanks for all the info.
Barring the Republicans taking the state house and President Trump winning in a landslide in November, I don’t see Walz giving up these powers. Now we can’t have our kids in school because schools need the space for “daycare”. Well if the kids were all in school, they wouldn’t need daycare!
I’m guessing that the data for Kentucky would be similar – and yet we have a governor who is scared of his shadow; that we have to “be safe Kentucky”; it’s beyond lunacy!