Thanks again to C. Nelson for providing this chart. It gives you an ongoing sense of the lack of an actual epidemic in Minnesota. That could change, as it has in other places, but it hasn’t yet. Please note my usual caveats and frustrations about the difficulty in painting the true picture based on the way the state provides data. Deaths are given as date reported, not actual date of death. As I pointed out this weekend, according to the CDC, Minnesota added 15 deaths in April and 17 in May, just over the last couple of weeks. Hospitalizations are also not reported cleanly as number of people in the hospital on a specific day, nor are we given new admissions and discharges on a day. There is a case table by date of specimen collection, which probably is somewhat close to the day the person actually became infected, but it can take a week for the number for a particular day to be fairly stable.
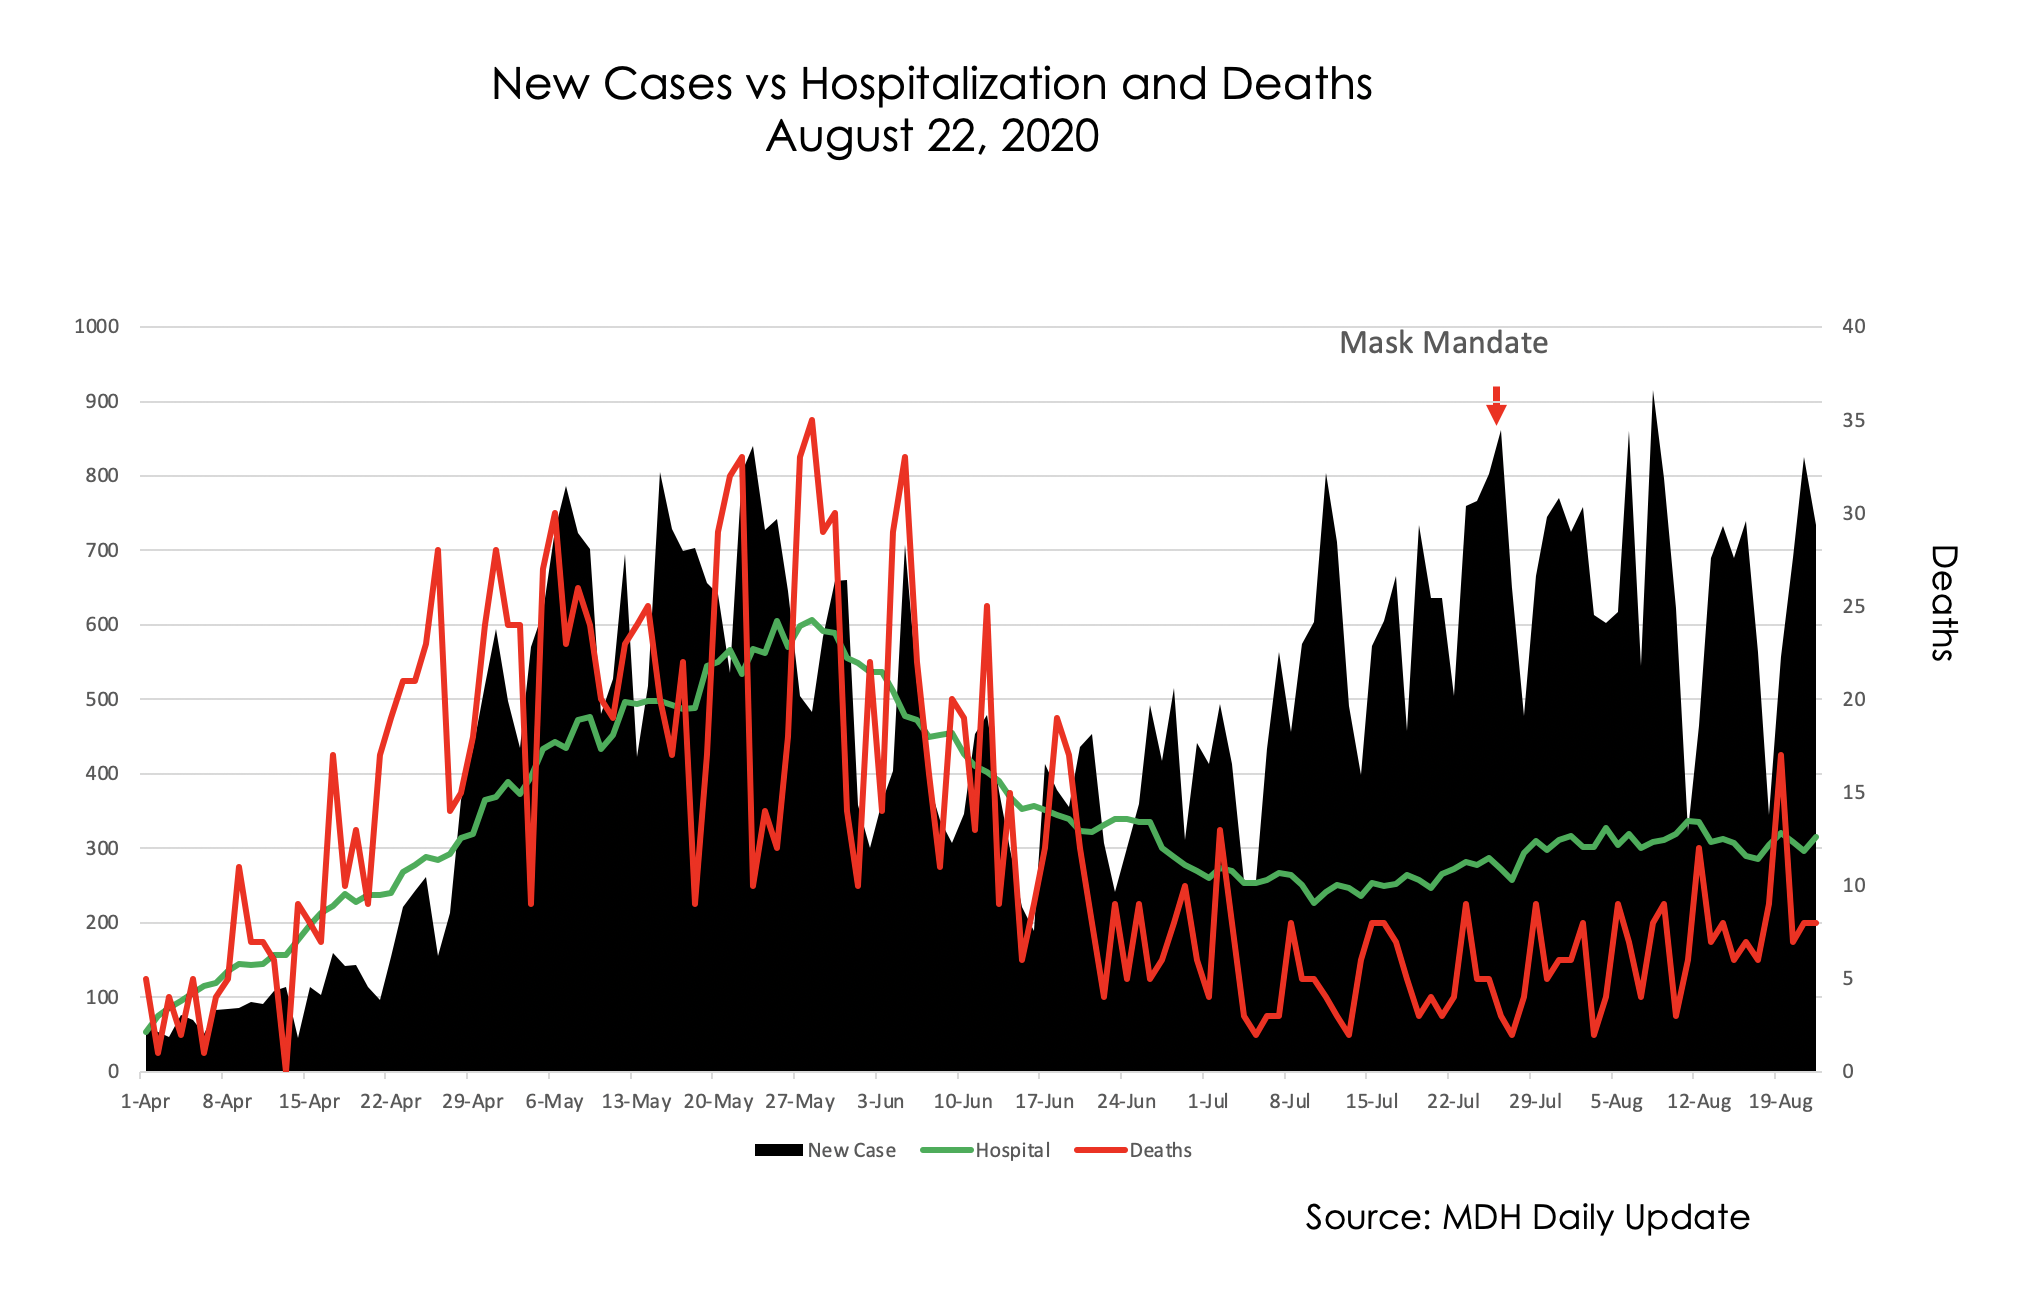

Excellent chart. One additional critically-relevant fact; daily testing volume has increased dramatically over this timeframe
Forwarded this to a couple local Constitution Club people: they want us to forward on to others to get them to call in to our Despot County Tyrant Commissioners at their online meeting tomorrow night. Pray we have some success in getting them to lift this oppressive mask / muzzle / totalitarian / as a “Heil Hitler” in Nazi Germany mandate.