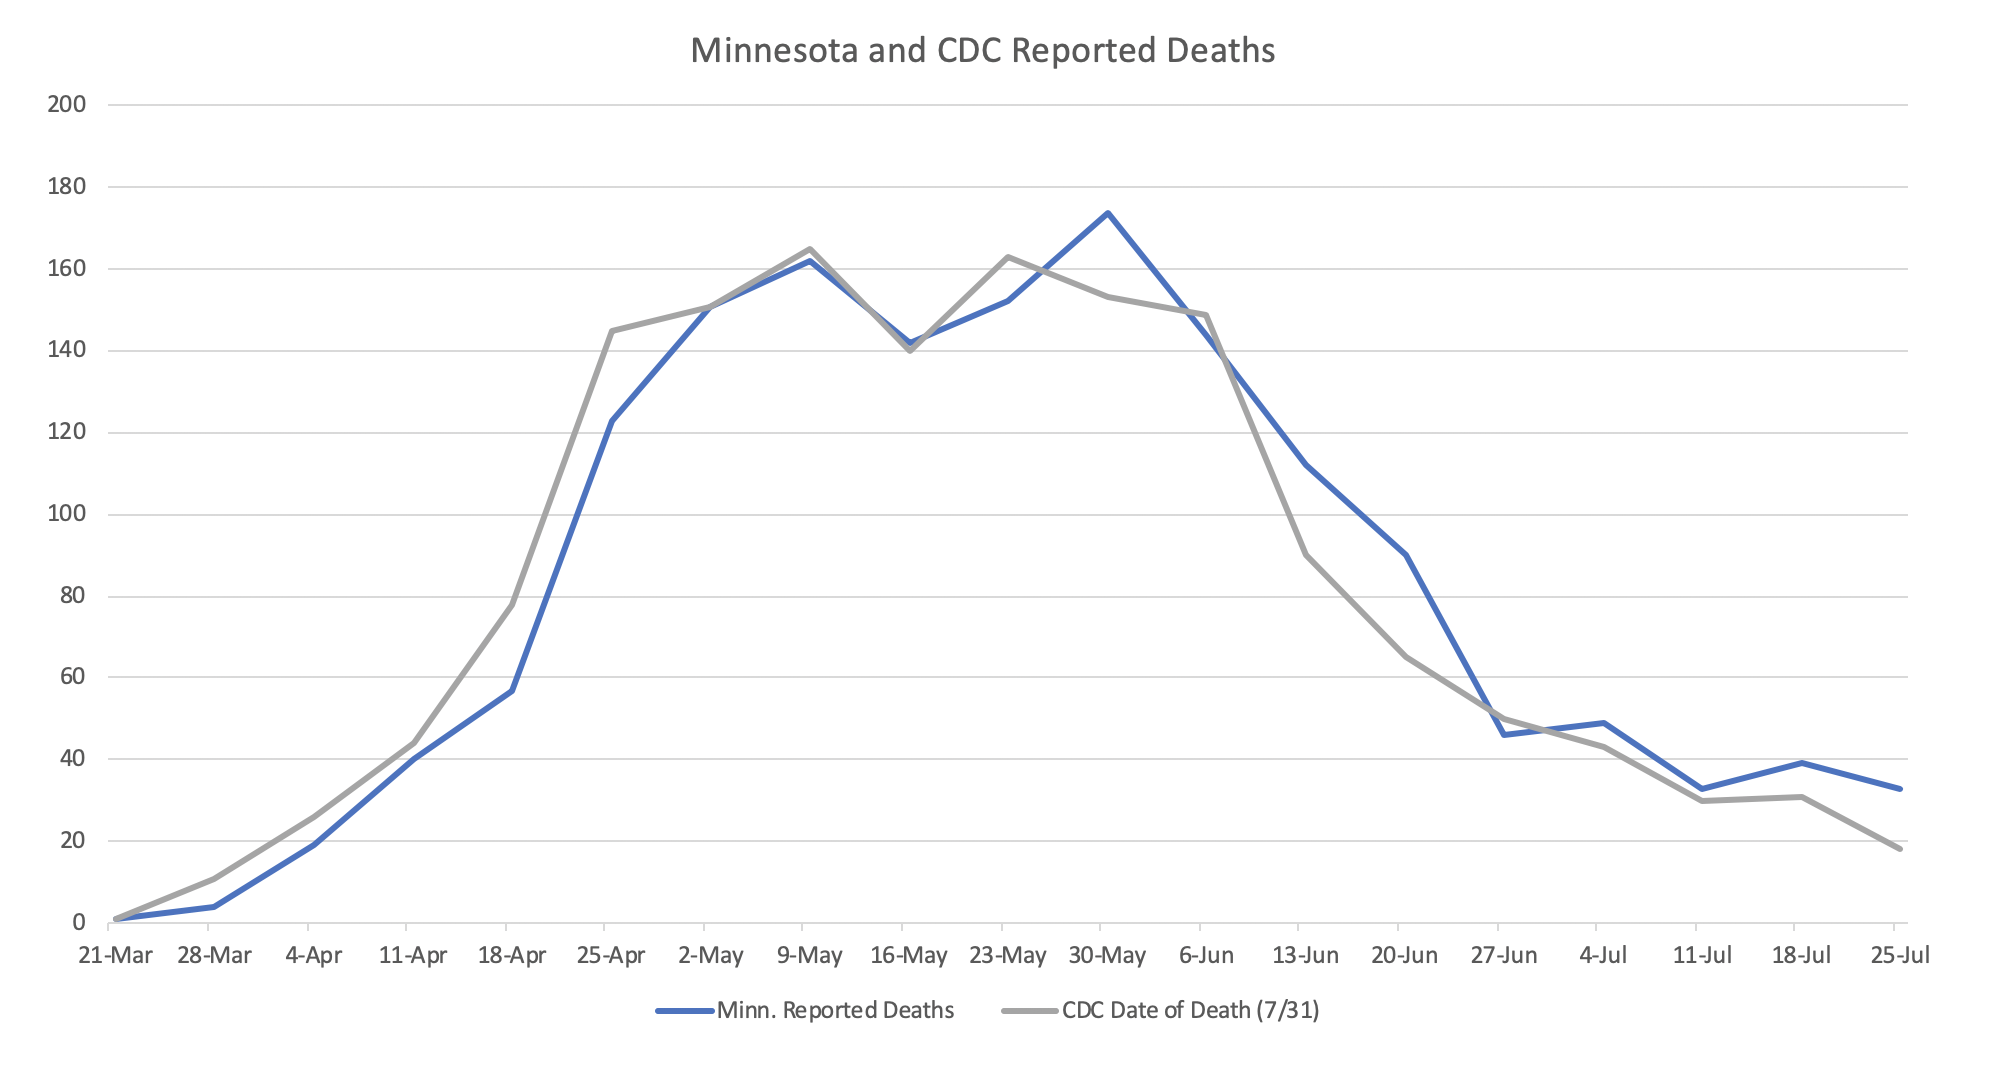
A couple of weeks ago I posted a table showing the difference between Minnesota’s death reporting, which is the date of report, versus the Centers for Disease Control, which is based on the actual date of death. Here is an updated table and chart. While not radically different, and because of the length of time covered the differences appear even smaller, you can see that the Minnesota approach on just giving date of report tends to lag actual deaths. The more accurate picture is date of death. Due to reporting lags, the CDC is often assigning deaths to earlier periods for months. Minnesota has the accurate date of death from the start. Why don’t they show us that?
So a couple of things to note. You will see there is now an original CDC column, that is from three weeks ago, when I first pulled this data from the CDC spreadsheet; and a July 31 column, that is for numbers I pulled from the CDC after their July 31 update. Note that as far back as April 4 deaths are still being added by the CDC, that reflects the lag in Minnesota’s reporting at this point, or amended certificates, wouldn’t want to miss any possible coronavirus-linked death. Note also that at the point of the last week covered here, the week ending July 25th, there is only an 18 death gap between the state’s reports as of that date, 1571, versus the CDC’s date of death reporting, 1553. In the original post the gap was 121 deaths. And finally, see that out of 105 deaths added by Minnesota in the three new weeks on this table and chart, 36, or over a third actually occurred in earlier weeks. Thanks again to Lisa Jansa for helping with the charts.
| Week Ending | Minn. Reported Deaths | CDC Date of Death (7/10) | CDC Date of Death (7/31) |
|---|---|---|---|
| 3/21/20 | 1 | 1 | 1 |
| 3/28/20 | 4 | 11 | 11 |
| 4/4/20 | 19 | 24 | 26 |
| 4/11/20 | 40 | 43 | 44 |
| 4/18/20 | 57 | 76 | 78 |
| 4/25/20 | 123 | 137 | 145 |
| 5/2/20 | 151 | 147 | 151 |
| 5/9/20 | 162 | 162 | 165 |
| 5/16/20 | 142 | 138 | 140 |
| 5/23/20 | 152 | 162 | 163 |
| 5/30/20 | 174 | 152 | 153 |
| 6/6/20 | 144 | 144 | 149 |
| 6/13/20 | 112 | 83 | 90 |
| 6/20/20 | 90 | 59 | 65 |
| 6/27/20 | 46 | 30 | 50 |
| 7/4/20 | 49 | 43 | |
| 7/11/20 | 33 | 30 | |
| 7/18/20 | 39 | 31 | |
| 7/25/20 | 33 | 18 |

1956 – 50.45 deaths of 2.8 billion world population.
1957 – 50.63 deaths of 2.9 billion world population.
1958 – 50.86 deaths of 3.0 billion world population: 1 million were of Asian Flu pandemic.
1959 – 51.09 deaths of 3.0 billion a world population.
1960 – 51.25 deaths of 3.0 billion world population.
—
1966 – 48.86 deaths of 3.4 billion world population.
1967 – 48.15 deaths of 3.5 billion world population.
1968 – 47.55 deaths of 3.5 billion world population: million were of Hong Kong Flu pandemic.
1969 – 47.08 deaths … of 3.6 billion world population.
—
2020 – projected 59.43 million deaths of 7.8 billion world population; so far 7/10 million attributed to COVID19.
Notice the 1958 & 1968 pandemics didn’t bump up the world death
counts, and they were each 5X / FIVE TIMES the magnitude of 2020 COVID.
Sources: https://www.macrotrends.net/countries/WLD/world/death-rate
https://www.worldometers.info/world-population/world-population-by-year/