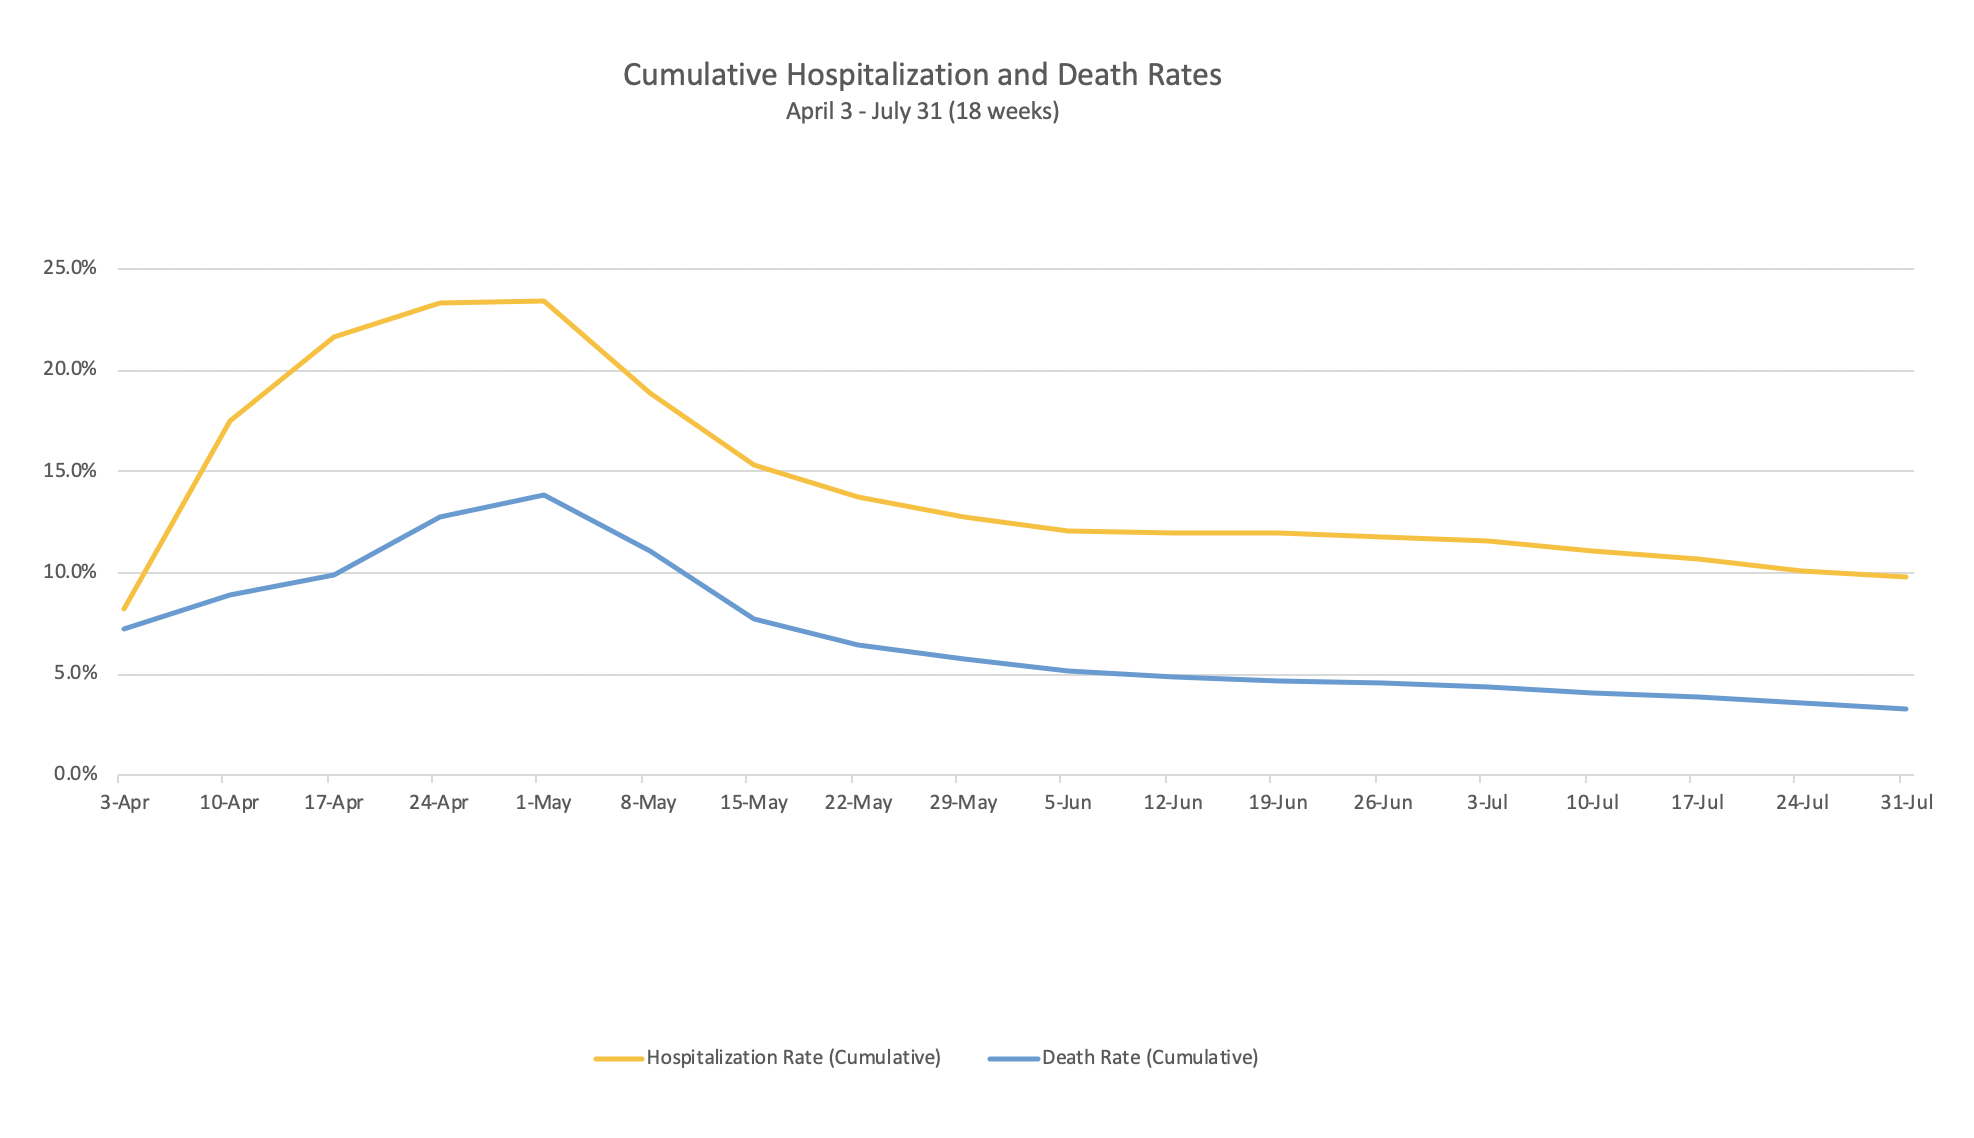
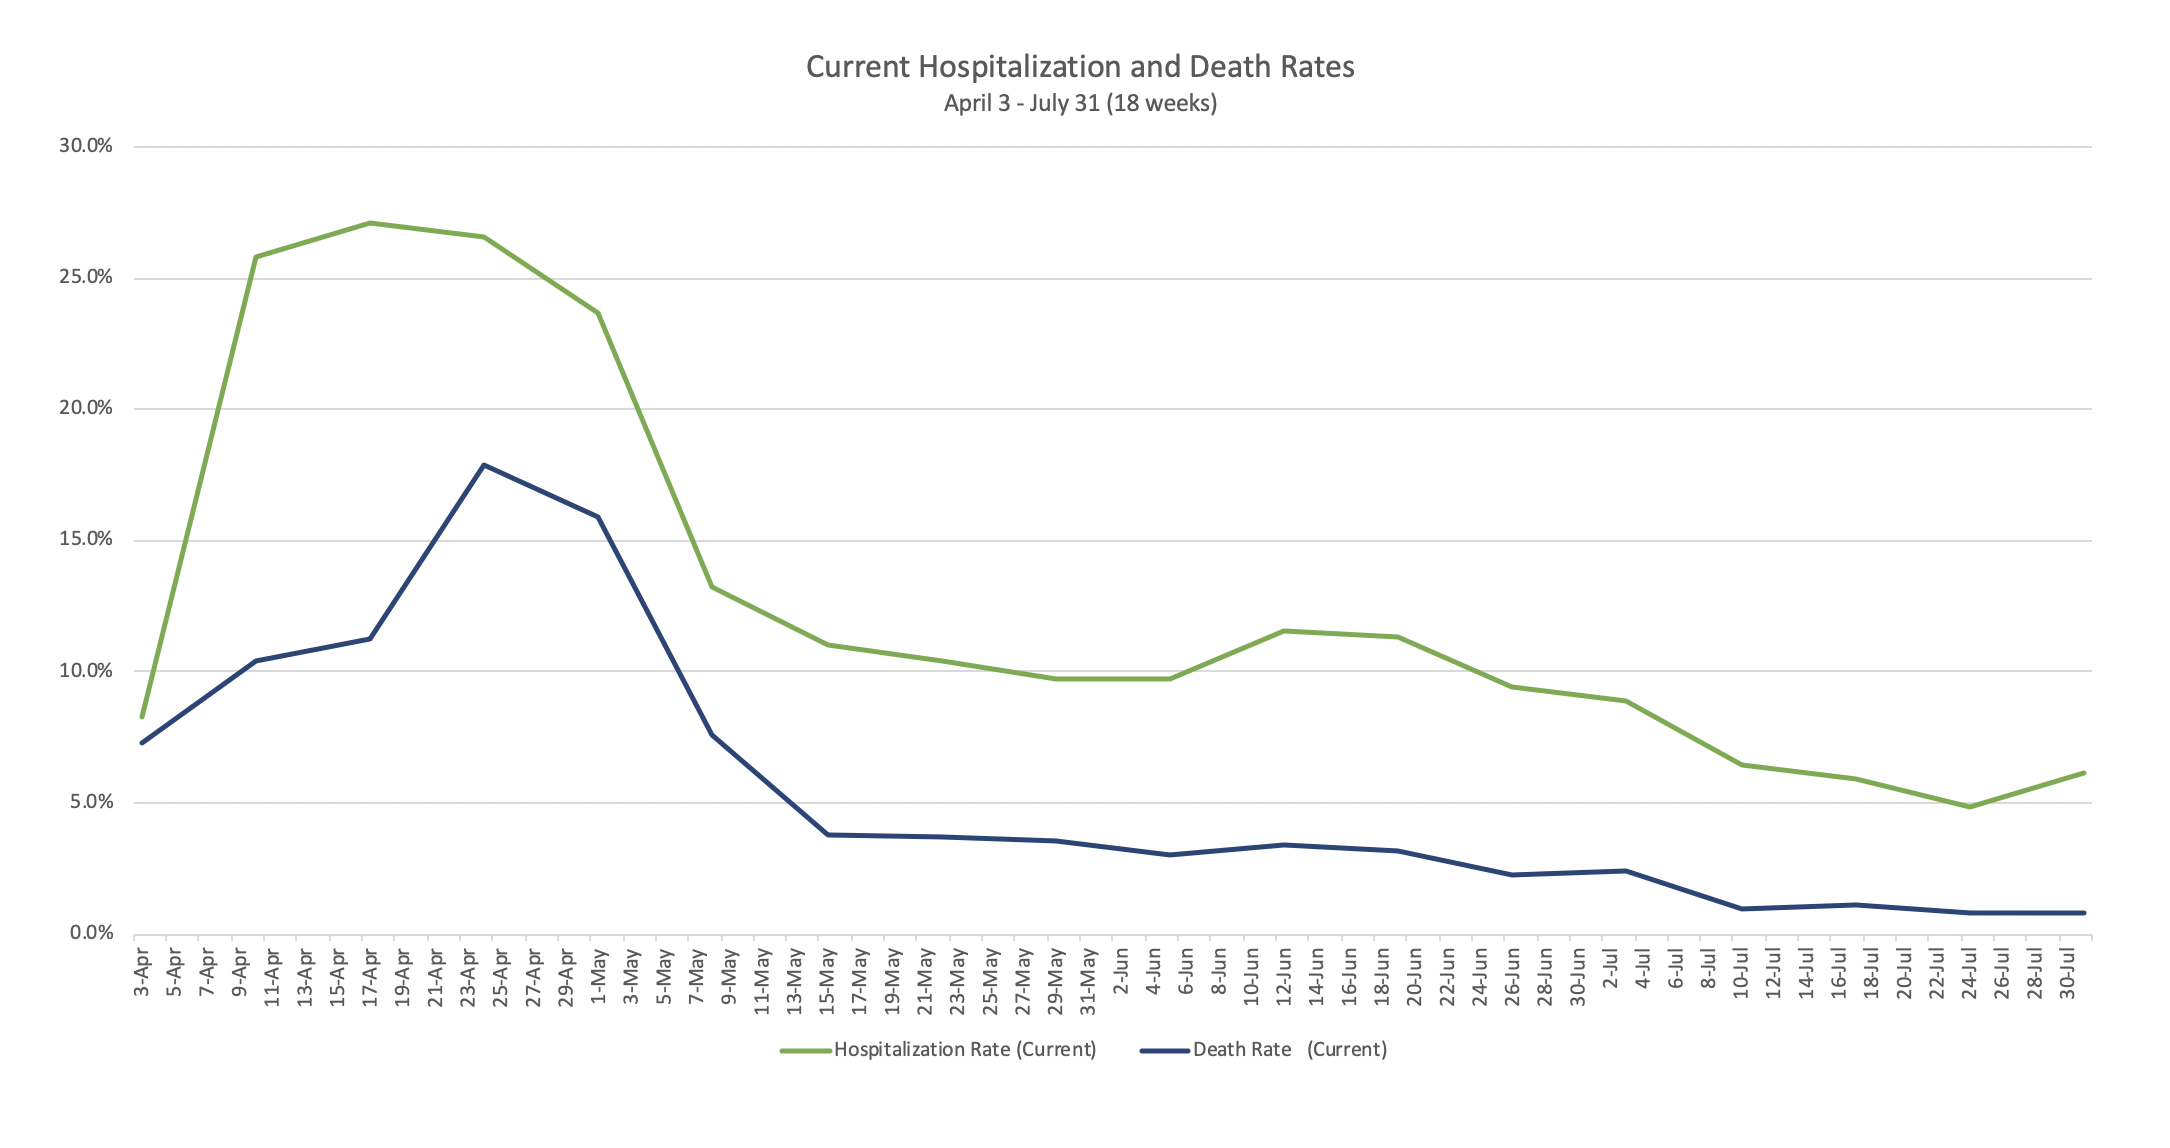
You may recall a couple of weeks ago I did a post with a table and I think a chart on trends in hospitalization and death rates as a function of cases. I have updated and enhanced those below. One think I learned is that case numbers can be retroactively adjusted as long ago as a couple of months but it seems to be single digit changes, so doesn’t really affect the calculations. You will note that in addition to the cumulative rates, I have separated out the most recent week, to give sort of a current picture. Remember this works back from deaths, for deaths reported in a certain week, hospitalizations are taken from ten days earlier and cases from 14 days earlier, based on the median lags reported by the CDC. So for cumulative deaths in the week ending July 31, for example, cumulative hospitalizations were taken from July 21, and cumulative cases from the July 17. The current rates reflect those number changes in a specific week. This is my attempt to create a cohort view. That is frustrated by the state’s refusal to give us deaths on the date they occurred and I recently learned that hospitalizations are also by day of report, and I have no idea what the lag is. I have been working on a deaths by date occurred chart, which I posted on, and in the next iteration of this chart, I am going to incorporate that work.
You can see the continuing decline in rates, although the recent week current hospitalization rate showed a slight uptick. I think this helps us all get some sense of real trends. And again, if the state and CDC are correct that actual cases are ten times reported ones, then divide all these ratios by ten. Thanks to Lisa Jansa for helping with the charts and table.
| Week | Report Date (Week Ending) | Deaths | Hospitalizations (10 days earlier) | Cases (14 days earlier) | Hospitalization Rate (Cumulative) | Death Rate (Cumulative) | Hospitalization Rate (Current) | Death Rate (Current) |
|---|---|---|---|---|---|---|---|---|
| 1 | 3-Apr | 22 | 25 | 303 | 8.3% | 7.3% | 8.3% | 7.30% |
| 2 | 10-Apr | 57 | 112 | 640 | 17.5% | 8.9% | 25.8% | 10.4% |
| 3 | 17-Apr | 111 | 242 | 1119 | 21.6% | 9.9% | 27.1% | 11.3% |
| 4 | 24-Apr | 221 | 405 | 1733 | 23.4% | 12.8% | 26.5% | 17.9% |
| 5 | 1-May | 371 | 629 | 2678 | 23.5% | 13.9% | 23.7% | 15.9% |
| 6 | 8-May | 533 | 912 | 4816 | 18.9% | 11.1% | 13.2% | 7.6% |
| 7 | 15-May | 682 | 1350 | 8777 | 15.4% | 7.8% | 11.1% | 3.8% |
| 8 | 22-May | 841 | 1799 | 13100 | 13.7% | 6.4% | 10.4% | 3.7% |
| 9 | 29-May | 995 | 2221 | 17422 | 12.7% | 5.7% | 9.8% | 3.6% |
| 10 | 5-Jun | 1147 | 2709 | 22442 | 12.1% | 5.1% | 9.7% | 3.0% |
| 11 | 12-Jun | 1272 | 3134 | 26122 | 12.0% | 4.9% | 11.5% | 3.4% |
| 12 | 19-Jun | 1359 | 3441 | 28838 | 11.9% | 4.7% | 11.3% | 3.2% |
| 13 | 26-Jun | 1411 | 3658 | 31138 | 11.7% | 4.5% | 9.4% | 2.3% |
| 14 | 3-Jul | 1466 | 3860 | 33410 | 11.6% | 4.4% | 8.9% | 2.4% |
| 15 | 10-Jul | 1495 | 4054 | 36432 | 11.1% | 4.1% | 6.4% | 1.0% |
| 16 | 17-Jul | 1533 | 4252 | 39772 | 10.7% | 3.9% | 5.9% | 1.1% |
| 17 | 24-Jul | 1566 | 4452 | 43897 | 10.1% | 3.6% | 4.8% | 0.8% |
| 18 | 31-Jul | 1600 | 4723 | 48300 | 9.8% | 3.3% | 6.2% | 0.8% |