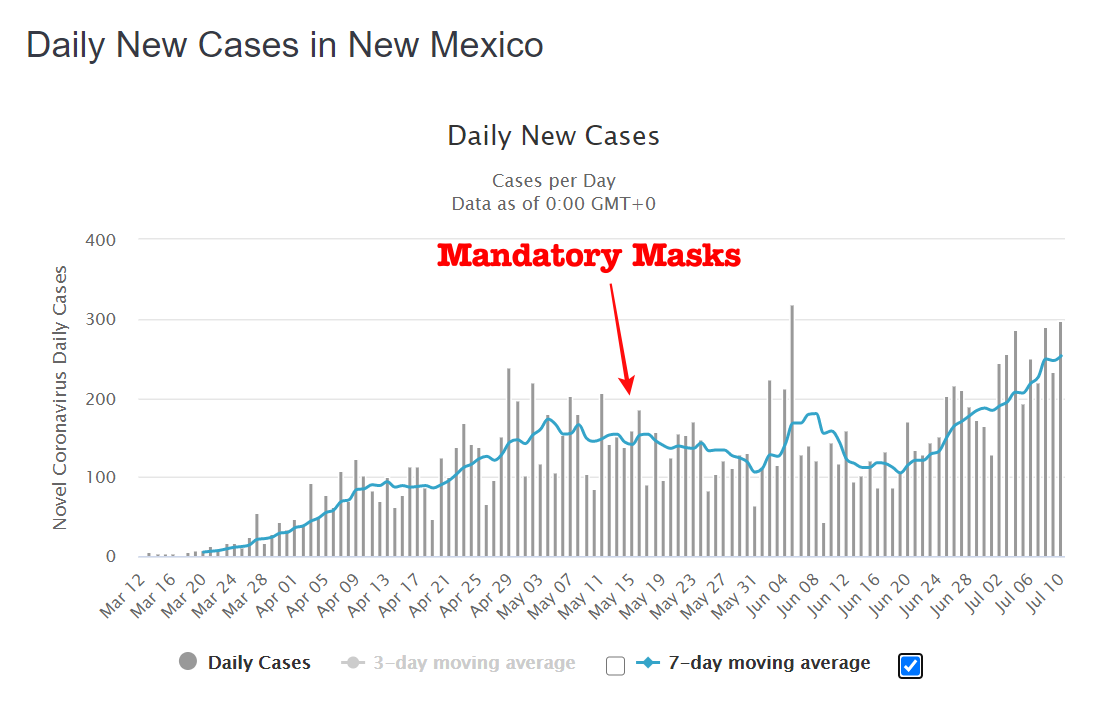
Take a state with a mask mandate from several weeks ago, that state must have been spared from the increase in cases that many states are seeing, right? Especially when that state is relatively rural. How about New Mexico, with a mask mandate going back to the middle of May? Oops, look at the graph, how could that possibly happen. And it looks pretty much like other states without a mask mandate or with a later one. And it doesn’t look like Minnesota or Wisconsin, which don’t have them. Now, maybe it would be even worse without a mask mandate, but if they are that effective, you wouldn’t see this. A hat tip to T. Heller for producing this graph.