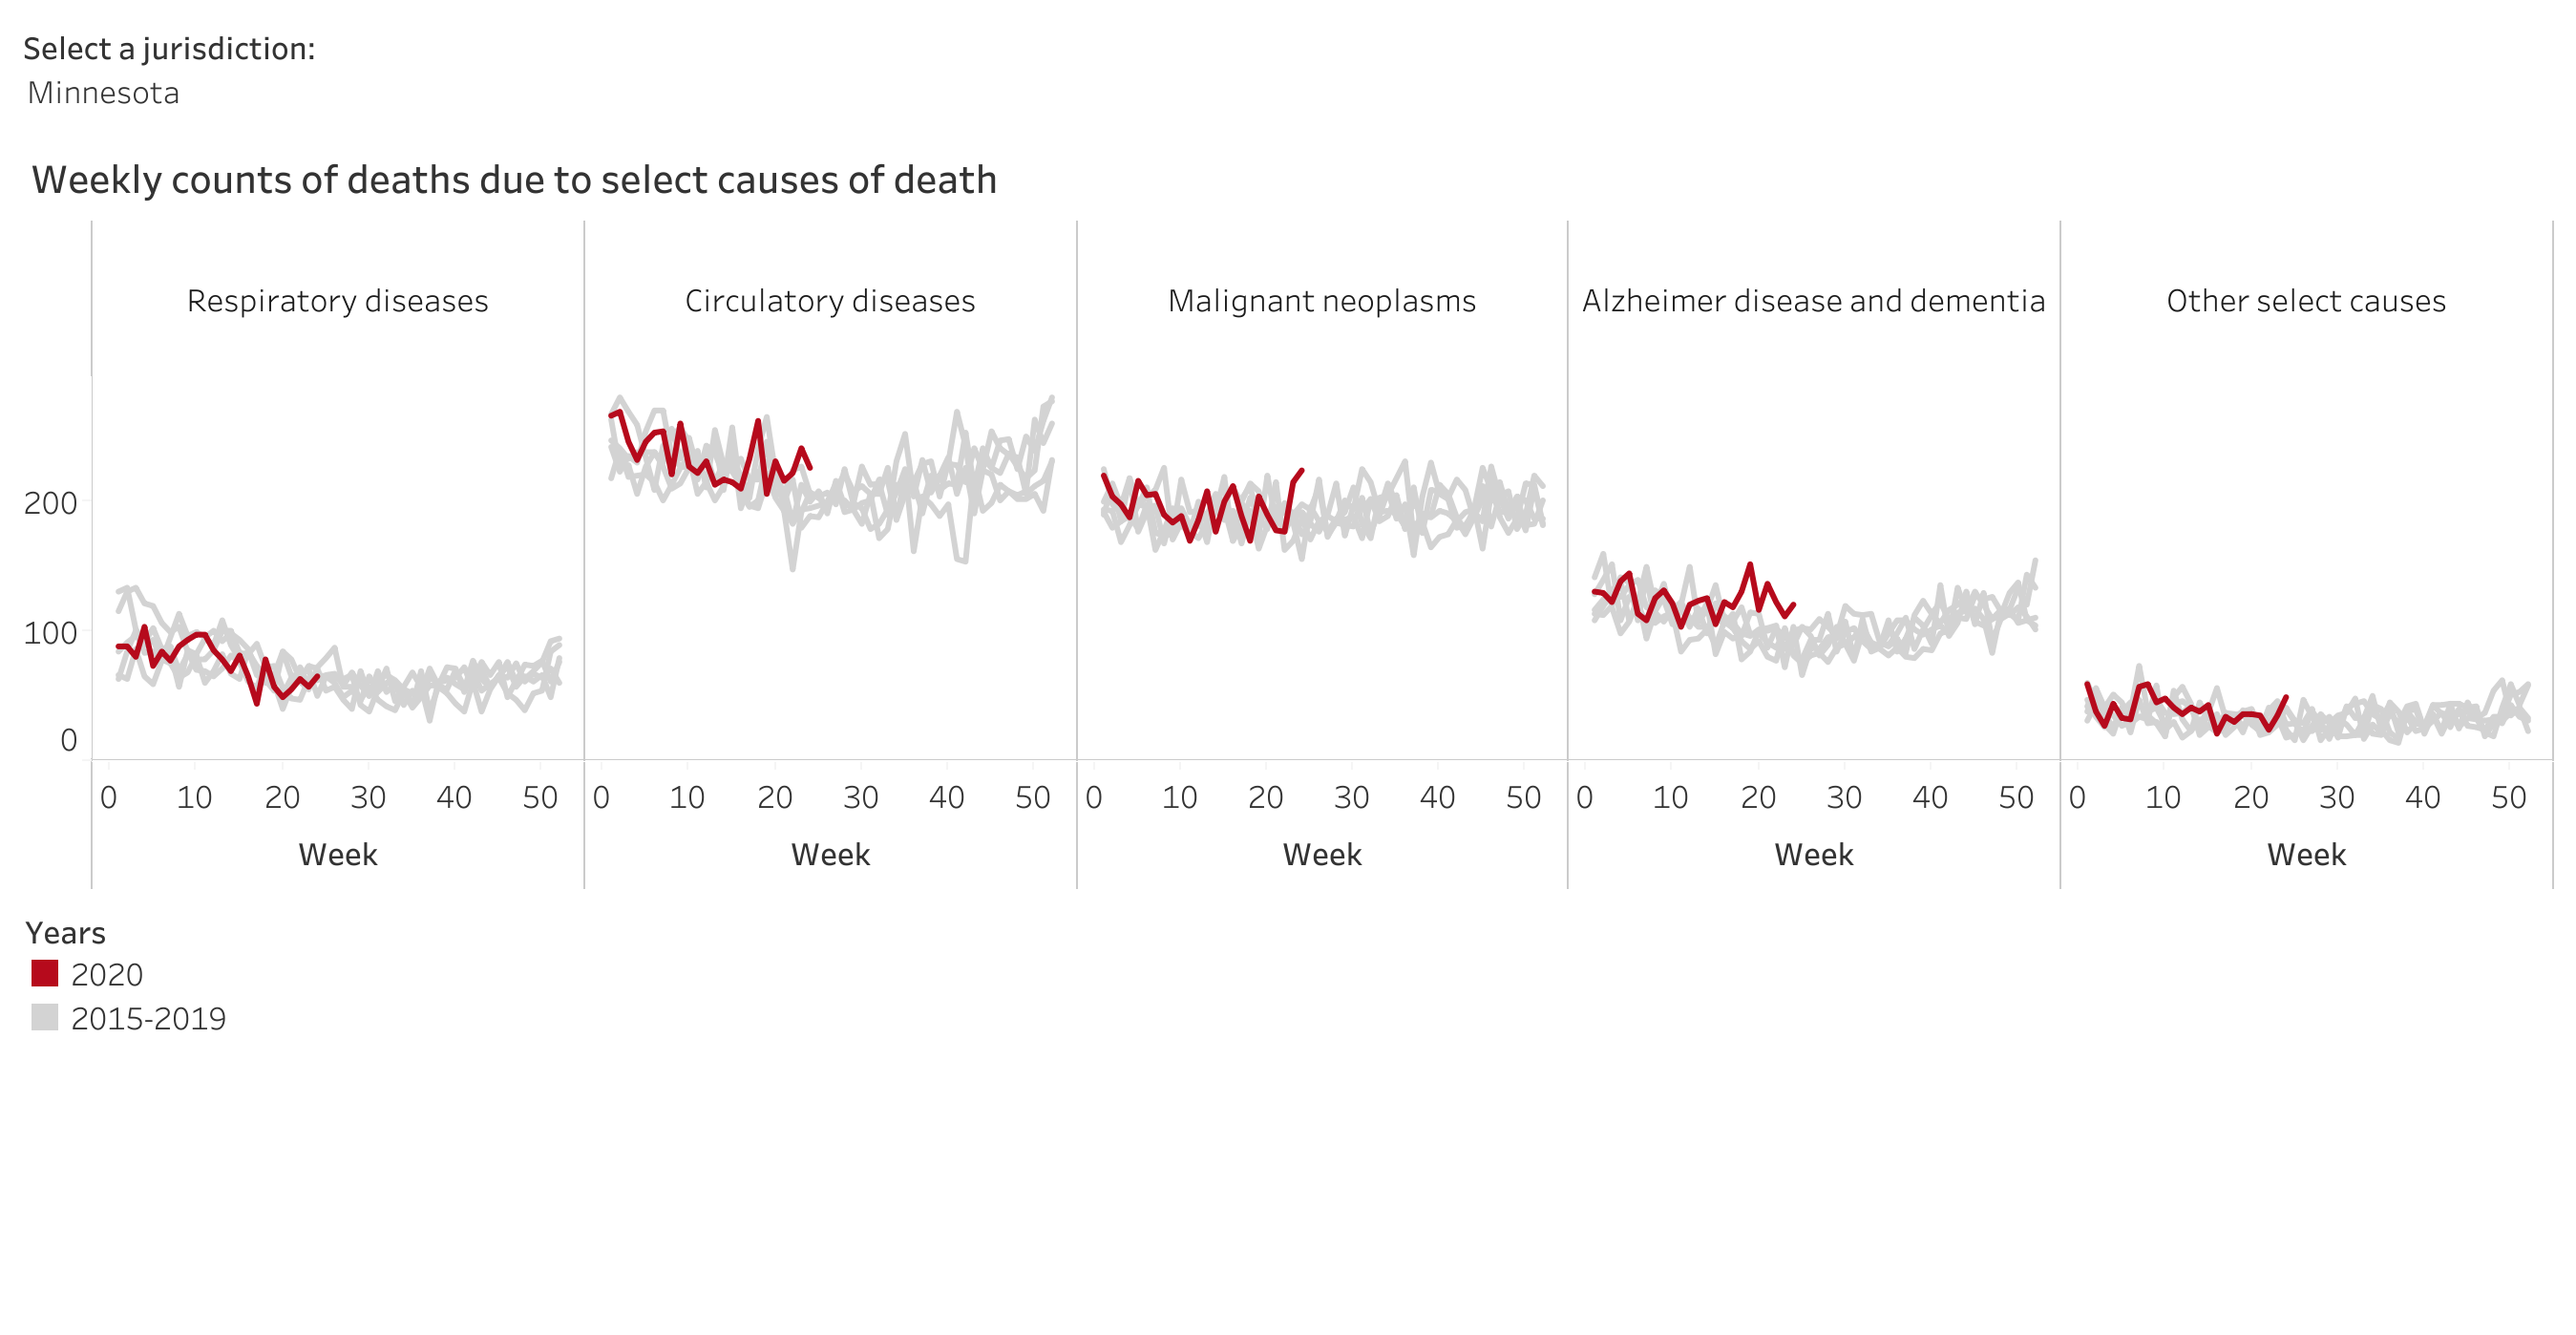
I was in the middle of my analysis and I ran across a dashboard that the Centers for Disease Control has on its website. You can look by state and see excess deaths by cause for 2020 compared to five prior years. I was blown away, a picture is truly worth a thousand words. Look below, this is the direct graph from the CDC. This is an astounding indictment of the state’s policy. Share this far and wide. This is what you see. For respiratory deaths, which include coronavirus (I think), deaths in 2020 are right in the middle of the pack. This demonstrates very clearly that coronavirus deaths are just substituting for influenza and pneumonia deaths. But look at all the other causes of deaths, very common ones. 2020 is at the top or above, in some cases significantly above all the prior years. This is testament to the deaths caused by the lockdown and by the fear-mongering campaign waged by the Governor. His terrorization of the population is directly responsible for these excess deaths, which even in 2020 are likely to be greater than those from coronavirus. I knew there would be an effect, but I did not expect it to be of this magnitude or this quickly. It is terribly sad, unnecessary and shocking.
A quick update, I should have included the link to the dashboard. (Excess Deaths DB) You have to select Minnesota from the drop down menu and you can get a variety of views and the underlying data tables. Please note that I am trying to figure out if the coronavirus deaths are definitely in respiratory, the technical notes, etc. are unclear, and I am looking at other spreadsheets and the data table to try to figure that out. What is clear is the excess deaths in the other categories.

Link to that chart?
This might help. You’re looking for ICD-10 U07.1 according to this site (below). The CDC graph legend does not list that code under Causes of Death respiratory section.
Respiratory diseases
Influenza and pneumonia (J09–J18)
Chronic lower respiratory diseases (J40–J47)
Other diseases of the respiratory system (J00–J06, J20–J39, J60–J70, J80–J86, J90–J96, J97–J99, R09.2, U04)
ICD-10-CM is the United States’ clinical modification of ICD-10. The code sets are not identical, but the CDC has announced that a new ICD-10-CM code will be effective April 1, 2020: U07.1 COVID-19.
Source: https://www.aapc.com/covid-19/
Thanks so much. A good friend (a senior NASA engineer, smart fellow) sent this chart into a chat we were having. I started looking at it, but as you note, it’s quite complicated and I hesitate to counter an argument based on my analysis of the data. Plus, I don’t have 40 hours to scrub it. But I detected the same problem you are pointing out in your piece. If the data stays honest (don’t want to sound like a tin-hat wearer), this sort of data is going to be the answer to “how dangerous was/is this virus” as we do the cost-benefit calculation going forward (and hopefully in retrospect for accountability). Please plug on.
I’ve said from the start that this has ALWAYS been the Trolley Problem, not the simplistic (and obviously politicized) “blood on your hands” narrative of the hyper-partisan power seekers.
I’ve been looking at that page for a few weeks now. I think the “Weekly counts of deaths by age group” is a very good set of charts as well.
Basically, in USA and most states, after a spike in deaths in the spring about the 5 year trend across all of the older age groups, there is now a distinct drop in the more recent weeks, was below the 5 year trend.
Some of that drop is attributable to the timing lag of reporting deaths to the CDC, but a very big part of it is clearly the “harvesting effect” of Covid accelerating the deaths of people who were likely going to die later in the year. With those deaths happening early, there is “no one left” for Covid to kill now.
To tell the truth, I seem to see a spike in the Alzheimer / demented patients. Since dementia is not a direct cause of death, I suspect that, being most of these patients in a nursing home, the number includes the COVIDs from the facilities, which are quite a few.
If these data are anything like they appear, the lockdowns were nearly useless (in most jurisdictions), and the tocsin call to re-close everything is a complete fraud, intended to shut down commerce rather than to protect the vulnerable. If only our news media would report the data, instead of the hype.
I think myollnir is correct. If you look instead at the bar charts for the deaths by week above average, you see huge spike in dementia. Reading the notes, it looks like a patient with dementia who had covid is still listed as dying of dementia, and a terminal cancer patient who had covid is still listed as dying of cancer. So these “above average” are really the covid 19 cases, and could actually be the cause of death (from covid not just with covid.) These also appear not to just be substitutions for other respiratory deaths, since the numbers aren’t lower than average in those categories.
But you already know we were killing the elderly.
‘