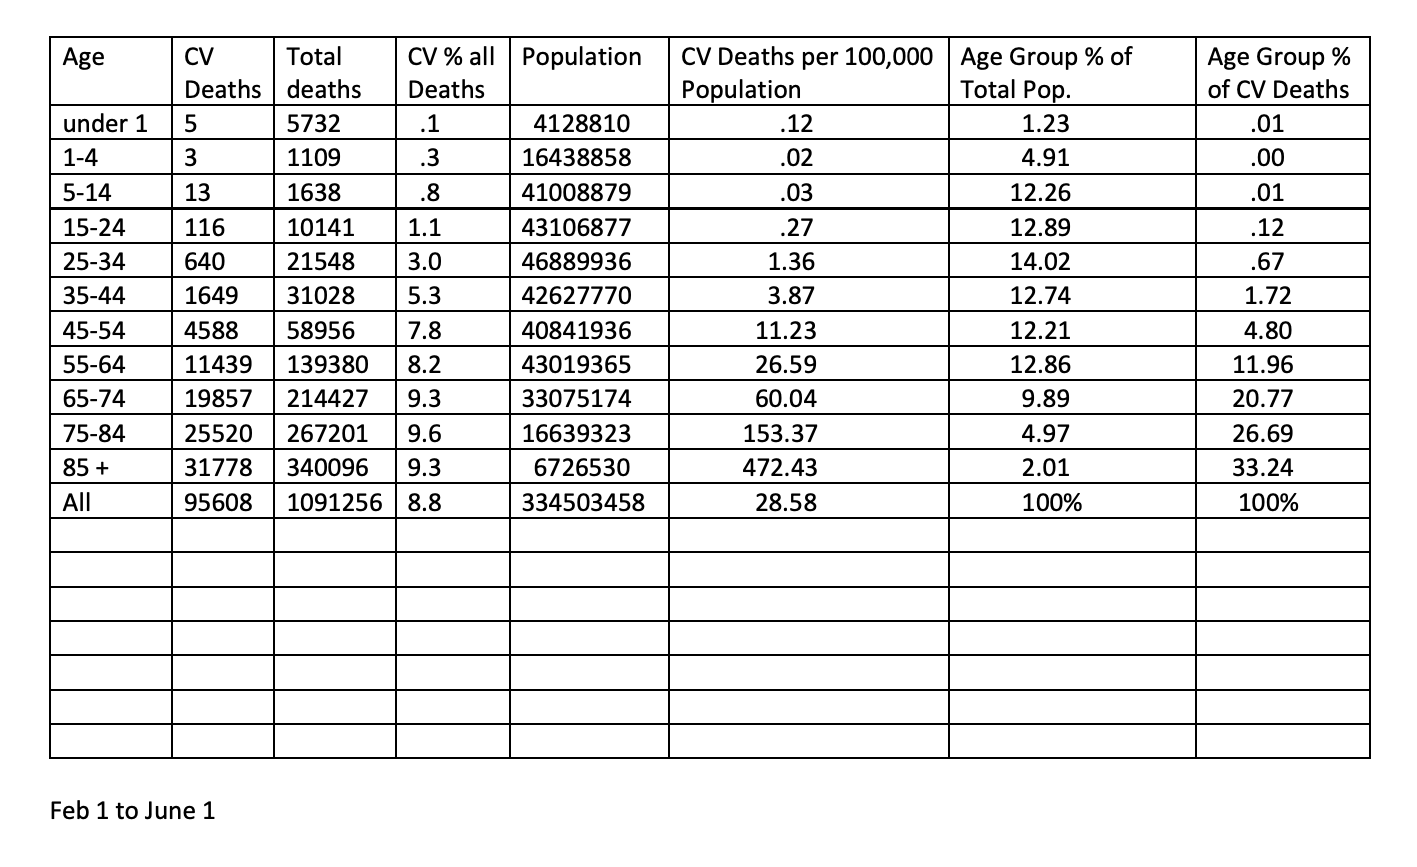
I have occasionally given results from the Centers for Disease Control’s official death count for coronavirus disease. Those counts show the dramatic skew of deaths toward the older population. Below is a table that gives, by age group, the population in the age group, the number of deaths from coronavirus in that age group, the total number of deaths from all causes for the age group, the percent of all those deaths accounted for by coronavirus, the percent of all deaths from coronavirus accounted for by deaths in the age group and a raw per 100,000 death count for the age group.
Notice that the over 75 age groups represent 60% of all coronavirus deaths. The over 65 year-olds are 81% of all deaths. And note again the extremely low risk for anyone under age 44 really and the virtually non-existent risk for those under age 24. If you are supposedly using data to inform public policy, I don’t know how you can possibly look at this table and conclude that a general lockdown is either necessary or a good idea.


Reaffirms that covid19 is more deadly for elderly with underlying conditions. It makes me wonder if there is a “cut” at the data to stratify by age vs # of CVD risk factors; in other words relative risk adjusted for diabetes, obesity (BMI), smoking, BP, similar to how Framingham Heart Study defines risk for heart disease?
If you factor in underlying conditions it’s even more telling:
https://www.worldometers.info/coronavirus/coronavirus-age-sex-demographics/