I am republishing this post, which I wrote over a month ago as the last in a series to help people understand modeling and the Minnesota model in particular. I am still working on more posts on modeling, including on the version 3 Minnesota model, but those are long and technical and take a while. The reason I am reposting this is because the emerging research supports the idea that there is a sizable contingent of people who don’t get infected. Because of that we likely get to population immunity quicker and even fewer people are exposed. My current guesses, and that is all they are, is that about 30% to 40% of people won’t be exposed; about 25% or so won’t be “infected” if exposed; around 30% will be asymptomatic or mild illness and the remainder will have moderate to serious illness. When we understand the true prevalence, I think the rate of hospitalization will be 1% to 2% and the fatality rate will be maybe .1% to .2%. Again, just guesses.
So here is my updated schematic to aid in thinking about the outcome of the coronavirus epidemic. The flow is basically the same as in the original chart but the look is a little different.
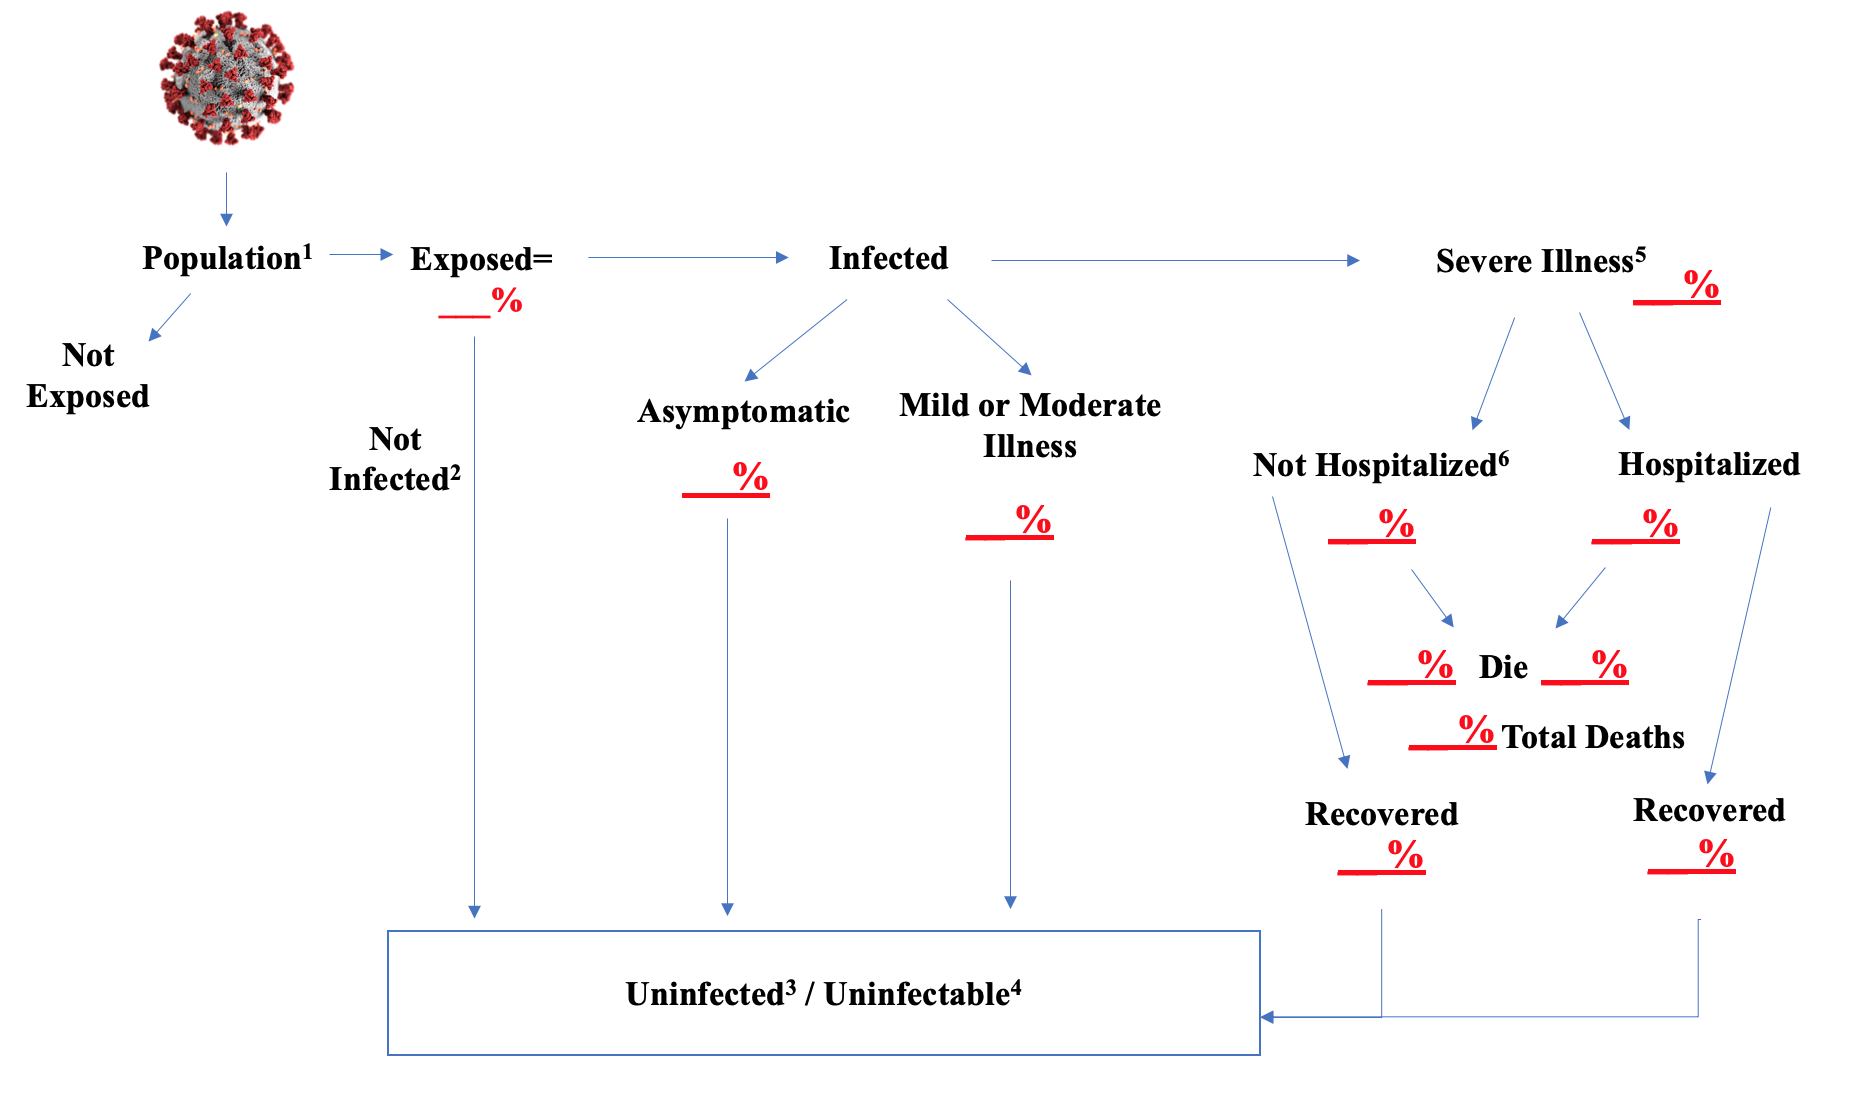
The footnotes give an explanation of issues related to certain steps.
- The population is whatever group you want to run the model against. It could be the country; or the state of Minnesota and many other states have models for their population. When you load the population into the model you should give it the relevant characteristics in the same proportion that they exist in the real world. So age, sex. Since this disease seems worse in dense areas, the population density of place of residence. People with underlying health conditions are more vulnerable, so those should be loaded in. Residential setting seems very important; a high percent of people in nursing homes and other senior living group settings are getting seriously ill and dying. The more characteristics that seem linked to disease and mortality risk you can load into the population in the model, the more accurate your results are likely to be. If one group seems particularly vulnerable, you might pull it out and model it separately. That should be done for senior group living settings for this virus epidemic.
- I think there is strong evidence that many people, even after being exposed to the virus, do not develop an infection. Children in particular fall into this category. Several studies in situations of close, extensive contact with the virus, find that a number of people who must have been exposed are not being infected. There could be several explanations for this phenomenon. One is that the “dose” was too low. To cause an infection, a person may need to take into their body a certain number of virus particles. That dose likely varies extensively by person. A healthy young person may not be infected even after exposure to a massive dose. It probably only takes a very small dose for a fragile senior in a nursing home to develop the disease. Some people may have antibodies to other coronaviruses that are capable of aiding in warding off this strain. Recent research shows that this is almost certainly the case. Some may have genetic variations in the receptors that the virus uses to gain entrance into cells or other genetic variations that make them more or less susceptible. And there may be other protective mechanisms that we simply don’t understand. If you knew what these reasons were, you could just build them into the population characteristics, but they would still then just not ever be infected.
- This “Uninfected/Uninfectable” bucket is designed to be one of “destinations” for people who have run all the way through the model. Unfortunately, the other one is death. The Uninfected is the group that we just discussed. It is conceivable that at least some of this group, could yet be infected, if the issue is dose. Someone who was exposed but the dose just wasn’t high enough, could later become infected if they encounter a higher dose. I doubt this would happen very often, but it could occur.
- “Uninfectable” refers to persons who have been exposed and survived and so presumably have antibodies or immunity against re-infection. There may be Uninfected persons who are also Uninfectable, if, for example, there are people with cross-reactive antibodies or genetic variations that are protective. I recognize that there may be a question about the durability and strength of antibody development, particularly in those who are asymptomatic or have mild illness, although the most recent research, which I will post on separately, does not find this to be the case.
- My gradations of severity of illness are “Asymptomatic”, these are people who became infected but are not showing any symptoms of the disease; Mild or Moderate Illness–these people had symptoms, may have sought some medical care, but whose condition would not warrant hospitalization; and Severe, which by definition is those whose condition did warrant hospitalization. The Asymptomatic and Mild or Moderate Illness groups all go to the Uninfected/Uninfectable bucket at the conclusion of their illness.
- Although the Severe Illness group is defined as warranting hospitalization, there will be those who do not go to the hospital. Many people, especially older patients, may have advance directives which limit the care to be given to them, including hospitalization. Others may have surrogate decision-makers who don’t want the patient hospitalized. And some will have such rapid exacerbation of the disease that they do not make it to the hospital. We know people are dying at home; we don’t know how many or why.
The schematic can be viewed as an end-state, or as the basis for creating formulas to drive the population through the flow. A few observations. Some part of the population is not going to be exposed. This typically is related to the infectiousness or transmissibility of the virus or other infectious agent. The more infectious, the more people need to have some form of immunity before transmission effectively ceases. There are formulas to calculate this, but it might not be unlikely to believe that for this strain of coronavirus, immunity needs to rise to 80% or so of the population. But also remember that there appears to be some percentage of the population which simply doesn’t become infected even after exposure. So it is the total of those people with antibodies and those who don’t become infected that may stop transmission.
Determining the speed of the spread into the exposed bucket and then out into the infected and serious illness buckets is also a critical part of any formulas. There appears to be a fairly well understood incubation period of about 5 days to develop symptoms. It is less clear how long it takes to determine that someone will need hospitalization. Determining the spread from infected people to the unexposed population is typically done by contact models, but these often don’t take some critical factors into account, as I mentioned in the comments about the “population” above. This transmissibility factor is very important.
The biggest unknowns in regard to this epidemic are what percent of the people fall into that uninfected after exposure bucket and what percent are asymptomatic or have mild to moderate illness. I am not sure how to establish the former, it is fairly clear it exists, but to what extent? The latter can be established by the kind of combination infection/antibody studies we are beginning to see results from. It is apparent from those results that a very, very small percentage of the total infections result in serious illness.
I am assuming unmitigated spread. If you are concerned about impact on health resource capacity, you would look at your daily runs of the model and compare the people who are hospitalized, need ventilators, need the ICU, etc. to your capacity. I have elsewhere given my views on the likelihood of this occurring. If you desire to, you can model the effects of mitigation tactics, primarily by modifying your formulas for how the infected mix with the unexposed population.
Appreciate any feedback, the statistical wizards out there can operationalize this and see what they come up.

The Issue with the Model Part 6: MN wasted over $1.5M paying for this POS. https://alphanewsmn.com/models-cost/