You may recall that a couple of years ago Dave Dixon put together charts showing temperature trends at weather stations in Minnesota that are part of the US network of stations that are deemed to be well-sited and most likely to identify real trends. Dave updated that work in light of the ongoing hysteria about mythical CO-2-caused global warming. The results, as they were the first time around, are quite interesting. The basics on how these charts were put together is that raw temperature data was used. The high for a day and the low for the day were added, then divided by two. Then those averages for all the days in a month were added together and divided by the number of days in the month, giving you the average monthy temperature. A month is used due to the length of time for the total record. Dave is working on further analyses showing the trend solely for the daily highs and daily lows. I expect that those will show that the warming is only present in the daily lows, as greater cloud coverage has increased night time temps.
Note again the clear pattern of warming in the northern part of the state and cooling in the southern area. Most of these stations have at least 100 years of data. Even the ones with substantial evidence of warming, over 3 degrees per century, show recent decades of no warming. In the southern part of the state, there several stations with cooling or no basic change over the entire period of warming. This pattern and the lack of a universal warming strongly indicates that this is not “global” warming but some more localized effect. I seen no climate hysteric analysis which could account for these results. Dave is going to look at our neighboring states to see if there is a similar geographic pattern.
 Dave’s notes:
1. In this post we are reexamining the daily temperature trends for several Minnesota sites. On 4/29/2022, here https://healthy-skeptic.com/2022/04/29/more-minnesota-rural-temperature-records/, we published temperature charts for several sites in Minnesota that are part of the United States Historic Climatology Network (USHCN). The USHCN is a subset of weather stations that were selected on the basis of “spatial coverage, record length, data completeness, and historical stability”, as described here: https://www.ncei.noaa.gov/products/land-based-station/us-historical-climatology-network. Note that accuracy of the temperature measurements isn’t necessarily a factor in selecting these sites. Proximity of buildings and pavement is suspected of influencing temperature measurements, as well as proximity to bodies of water. The sites where we have been able to access data tend to be located in small towns and more rural locations, however, we have not personally examined these sites to see if they are free from local temperatures influences.
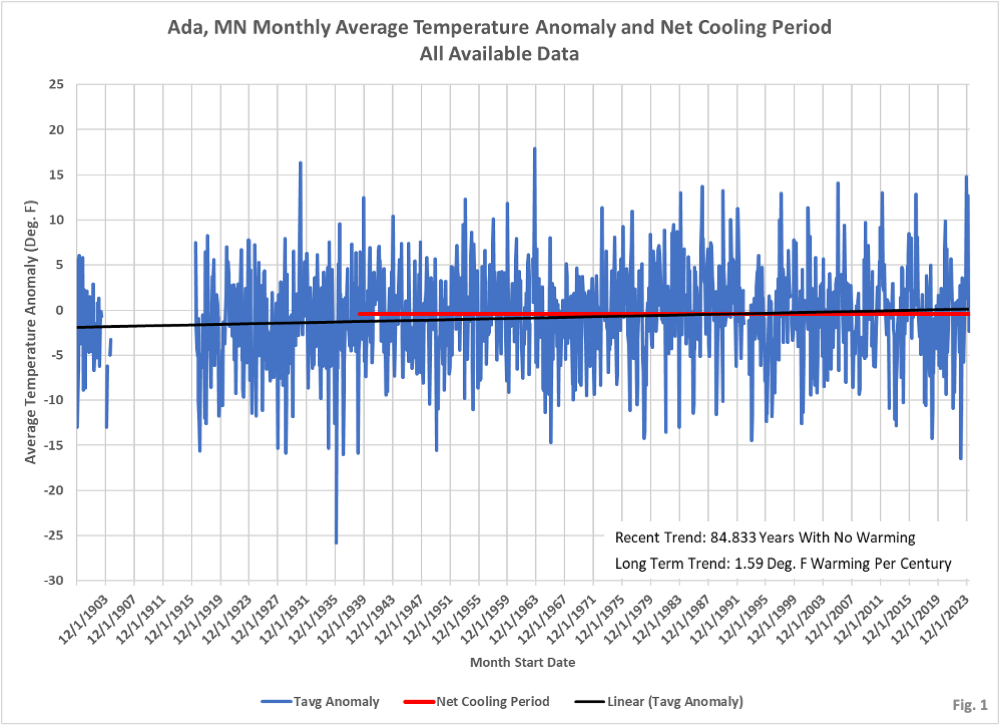
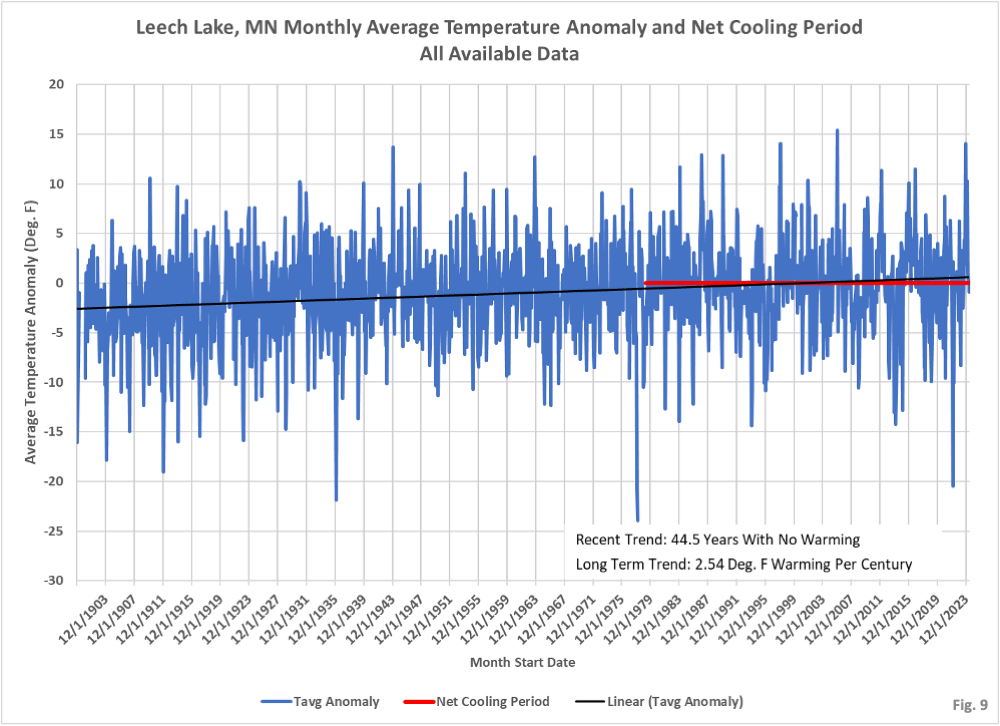
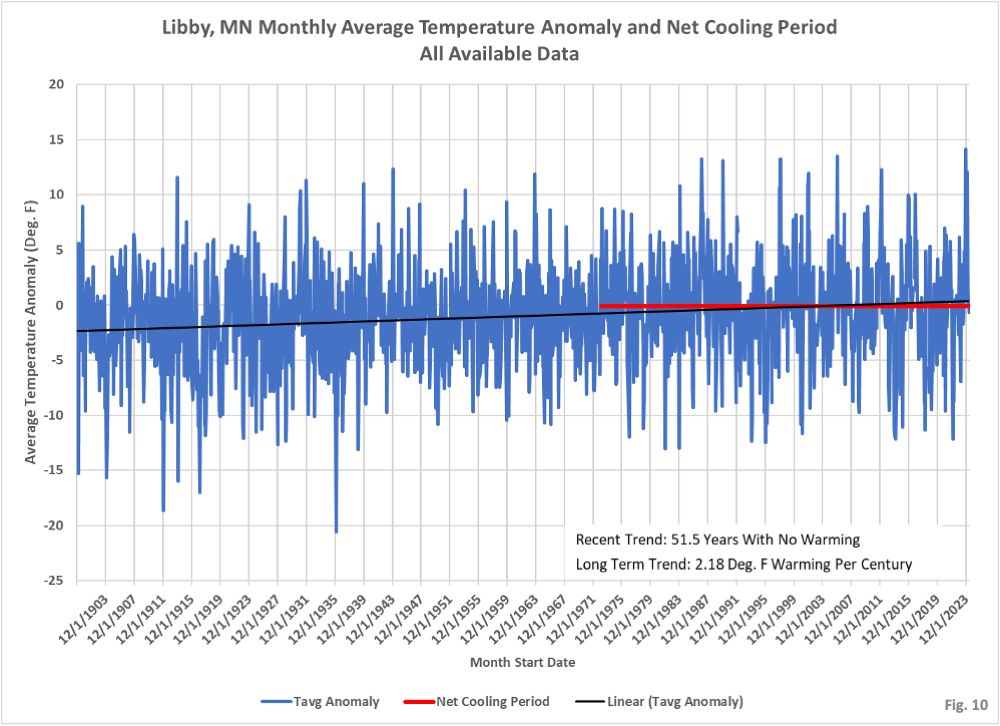
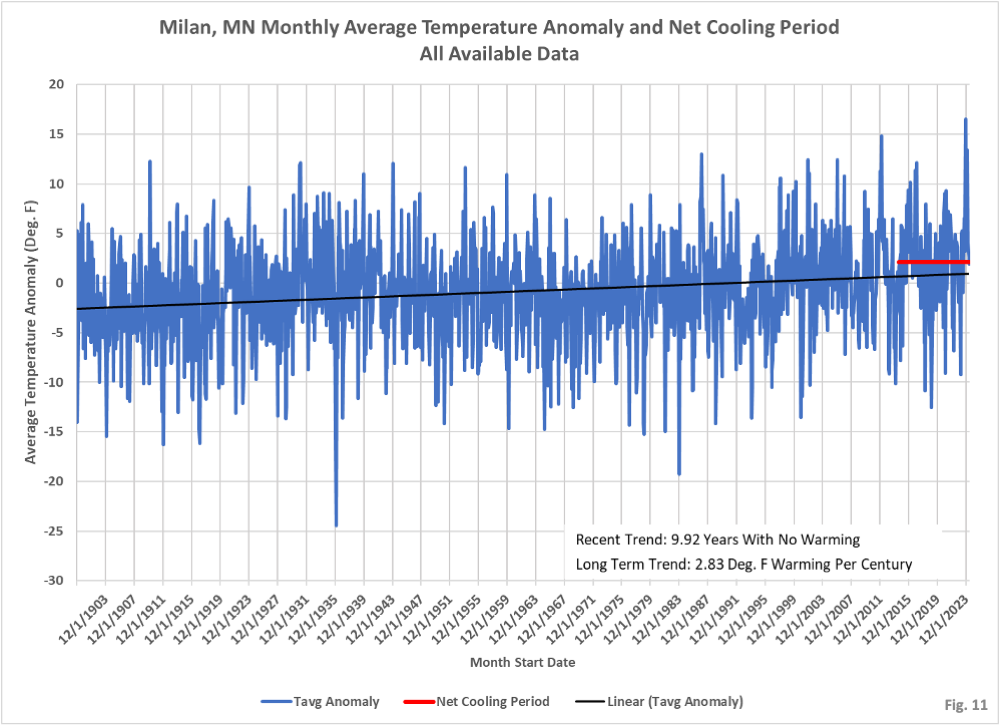
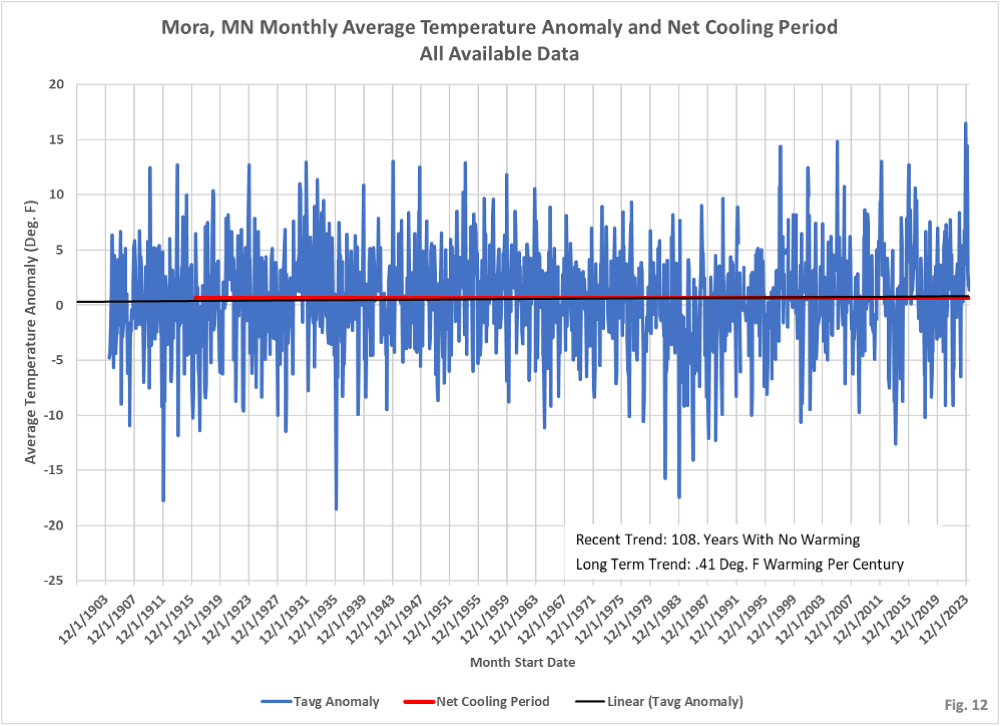
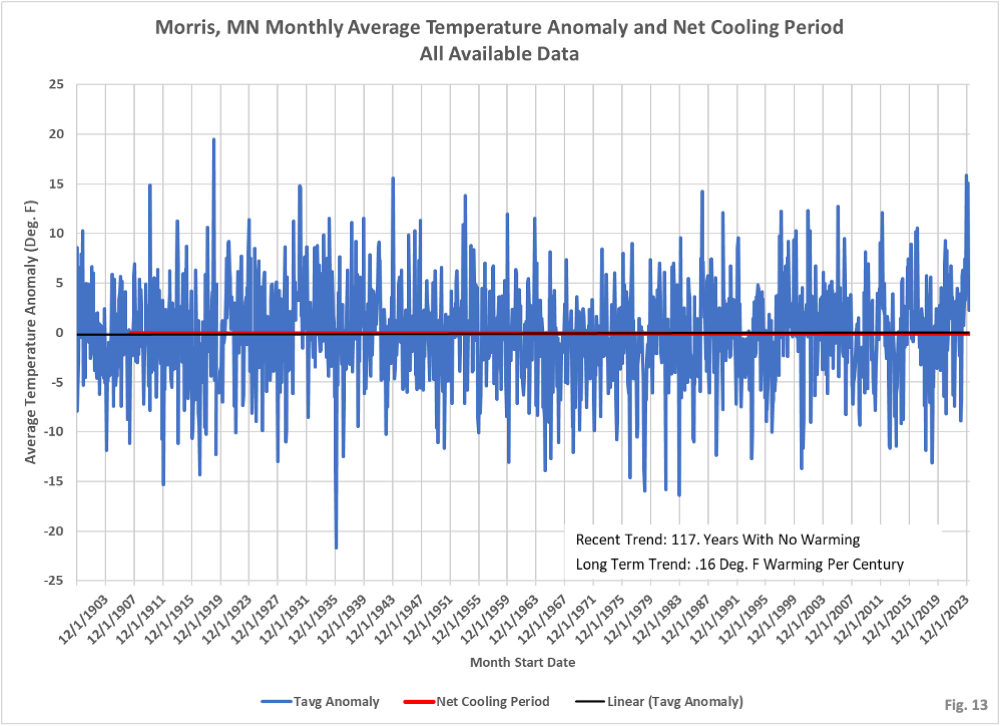
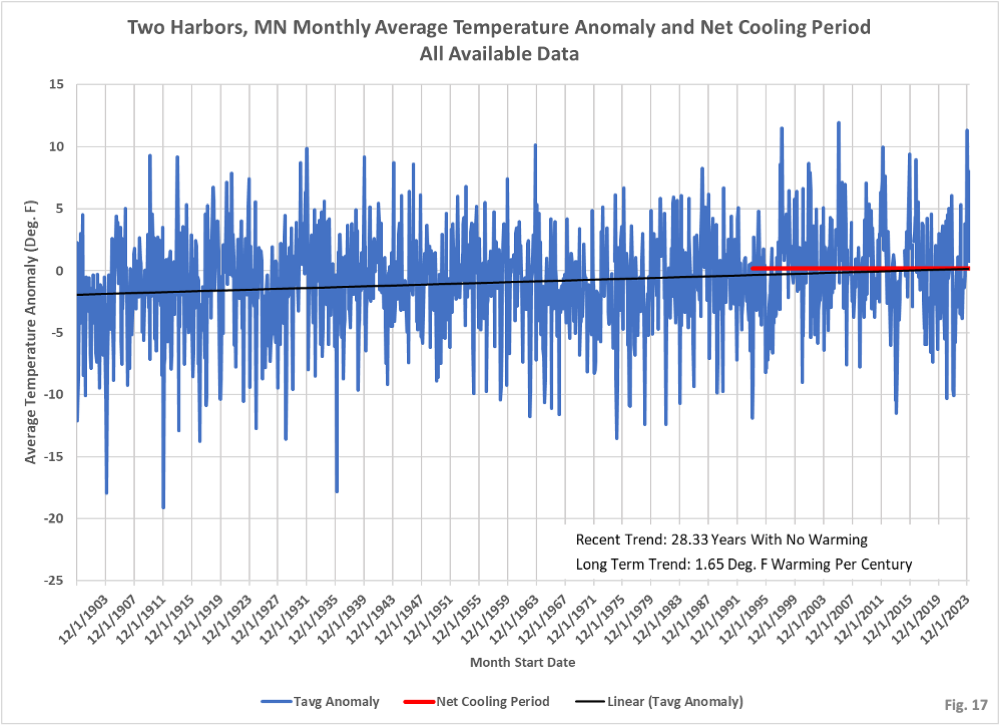
2. For each site we are displaying the monthly average temperatures, along with two linear regressions. In black, we are displaying a simple linear trend line generated by Excel for the entire data set. In red, we are displaying a trend line showing how far back from present can we go and still have a negative (cooling) temperature trend. For most of the sites the cooling trend line shows that there has been no warming for decades, sometimes many decades. For example, Ada, MN in Figure 1 has a cooling trend for the past 84.8 years. There are shorter warming and cooling trends within that time period, but we can still calculate a linear cooling trend going back over 8 decades.
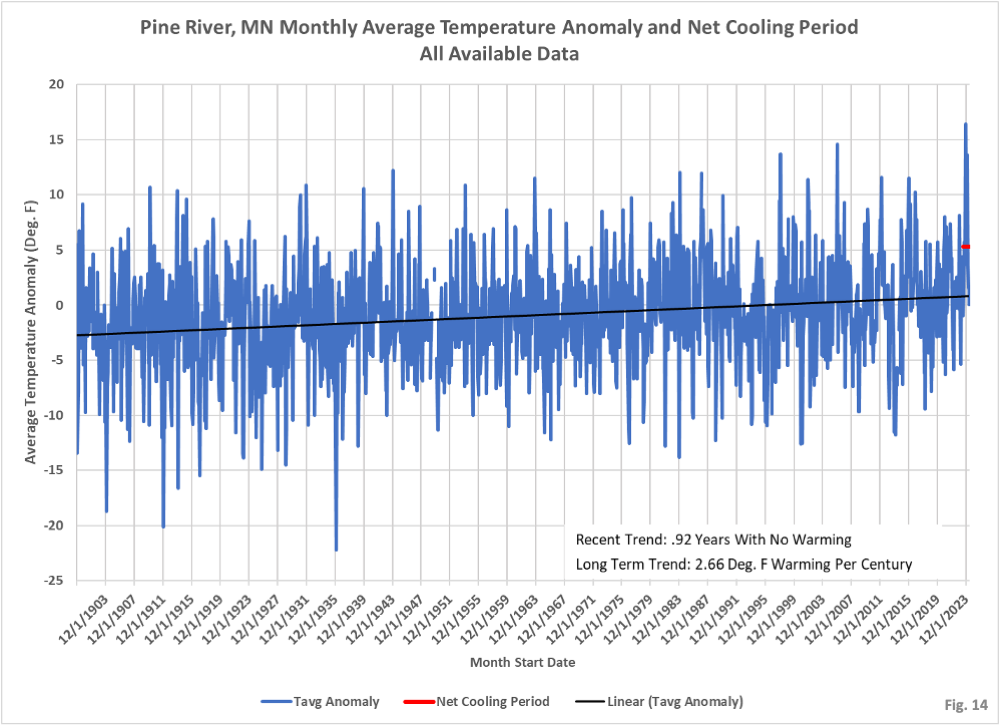
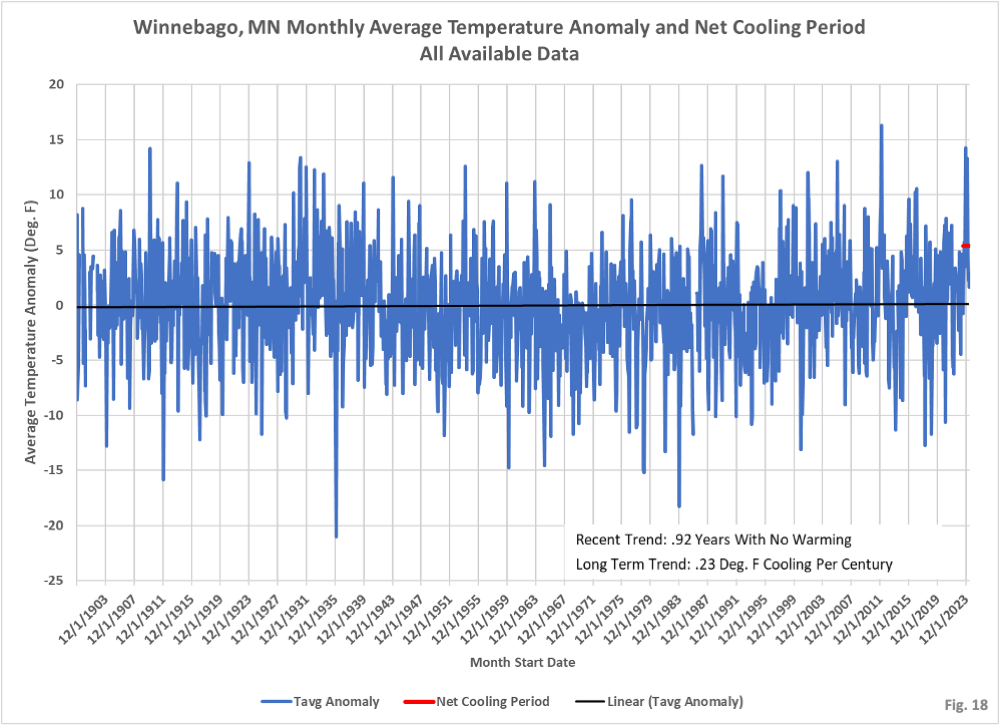
3. Several sites show very recent temperature spikes which over-ride the long term trend, creating very short periods of net cooling. For example, Pine River (Fig. 8) and Winnebago, MN (Fig. 18) both had high temperatures last summer which cause the cooling time period to be less than a year. This is something we have not seen before, where the cooling time period typically goes back several decades.
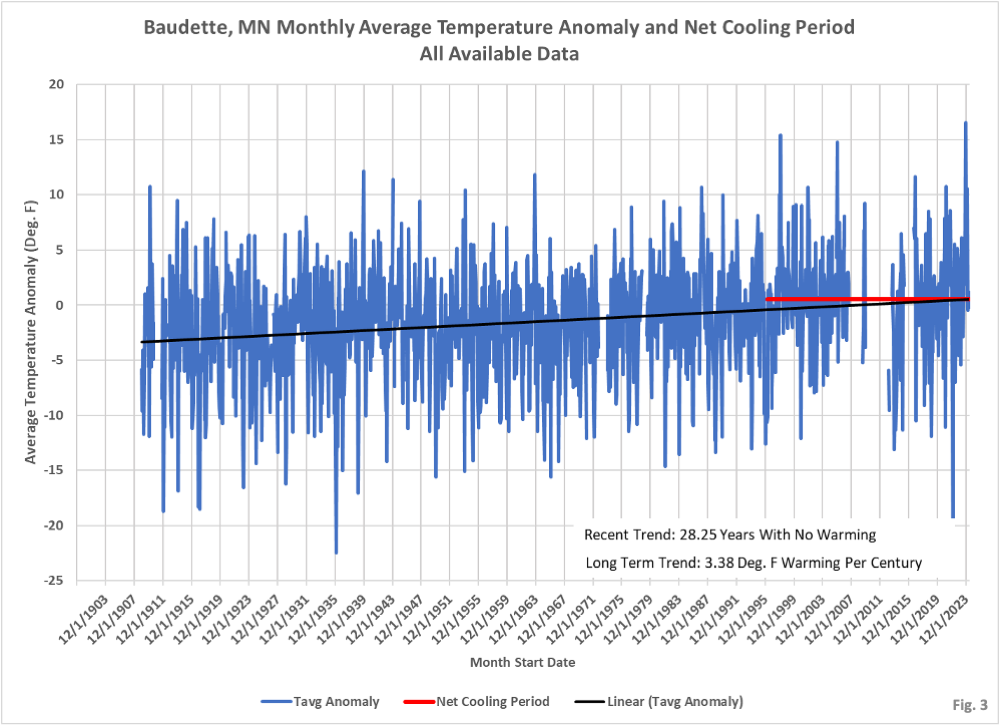
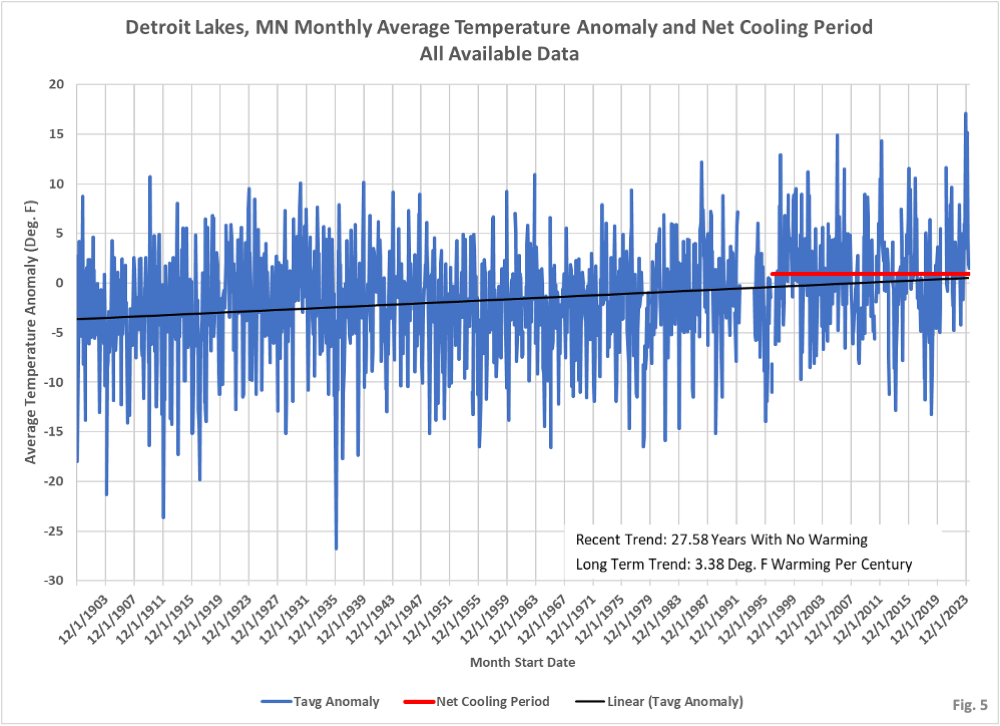
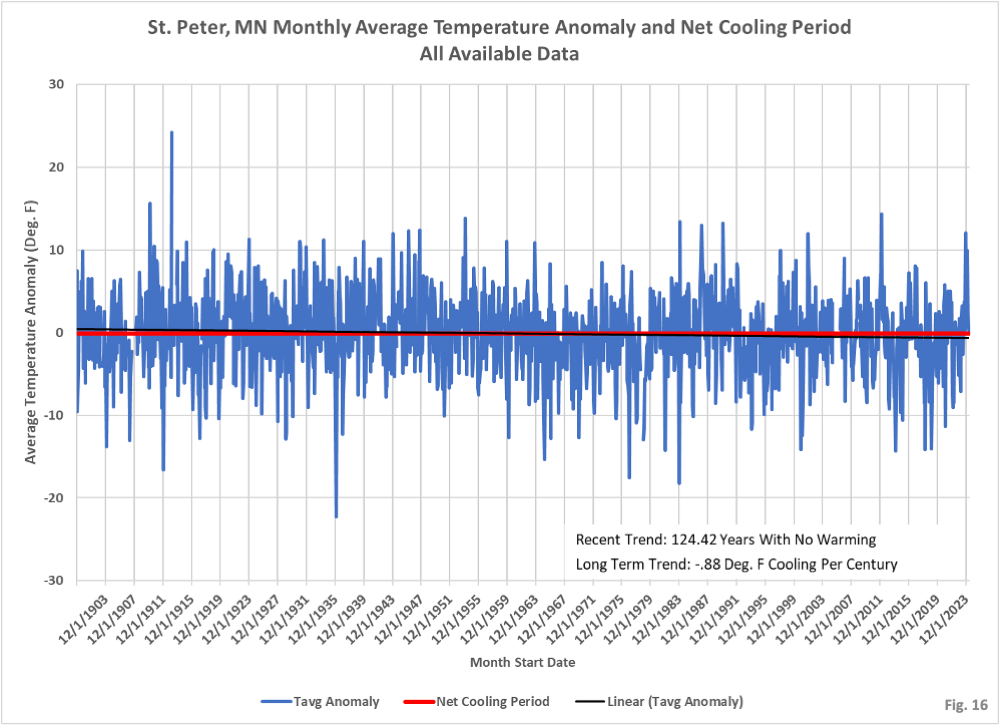
4. It is also interesting that there is a wide variety of magnitudes of long term temperature trends. The highest long term warming trend is Baudette (Fig. 3) with 3.38 Deg. F warming per century, matched by Detroit Lakes (Fig. 5). Meanwhile, St. Peter (Fig. 16) shows 0.88 Deg. F cooling per century. Minnesota has several different biomes, so it is perhaps not surprising that there may be different temperature trends. However, it does raise questions about the extent of global warming when some individual locations long term cooling of very slight warming.
5. The National Oceanic and Atmospheric Administration (NOAA) publishes monthly high, low, and average temperatures for each USHCN site, on both a raw and an adjusted basis. For our effort here we are not using this published data, but instead are using the raw daily temperature data downloaded from NOAA here: https://www.ncdc.noaa.gov/cdo-web/ and calculating our own monthly averages. We are avoiding use of the official USHCN data sets for now based on some reports that the adjusted versions of the USHCN data tended to increase long term warming trends. For example, here is an analysis at Climate Audit: https://climateaudit.org/2007/02/16/adjusting-ushcn-history/ which displays how the USHCN in the overall US had an increased warming trend from one adjustment version to another. Here is another analysis of USHCN adjustments at Watts Up With That: https://wattsupwiththat.com/2012/04/13/warming-in-the-ushcn-is-mainly-an-artifact-of-adjustments/.
6. After downloading the daily data the only changes made are to remove days with no data. When the data is downloaded days with missing data appear as zero, and if left in the data set would be treated as zero degrees in the analysis. Fortunately days with missing temperature data are also missing the time of observation notation, giving us a way to remove the days which are missing versus the days that are actually at zero degrees.
7. After calculating the average temperatures for each month, a baseline for each month if determined by averaging each month from January, 1981 through December, 2010. The anomaly for each month is computed by subtracting the baseline monthly temperature from each month’s average temperature.
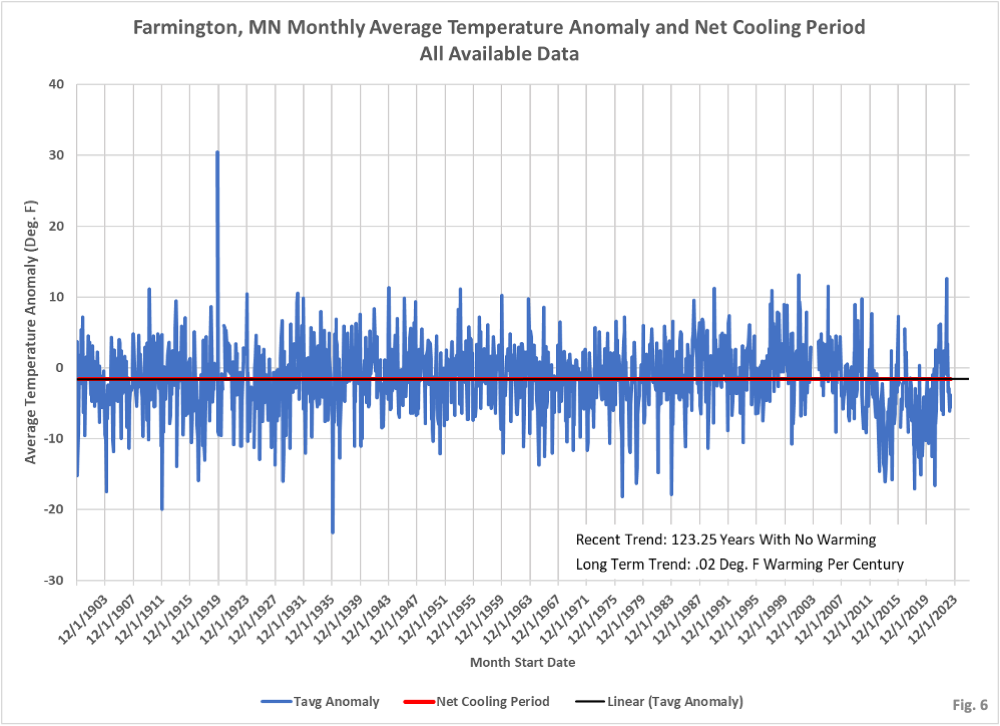
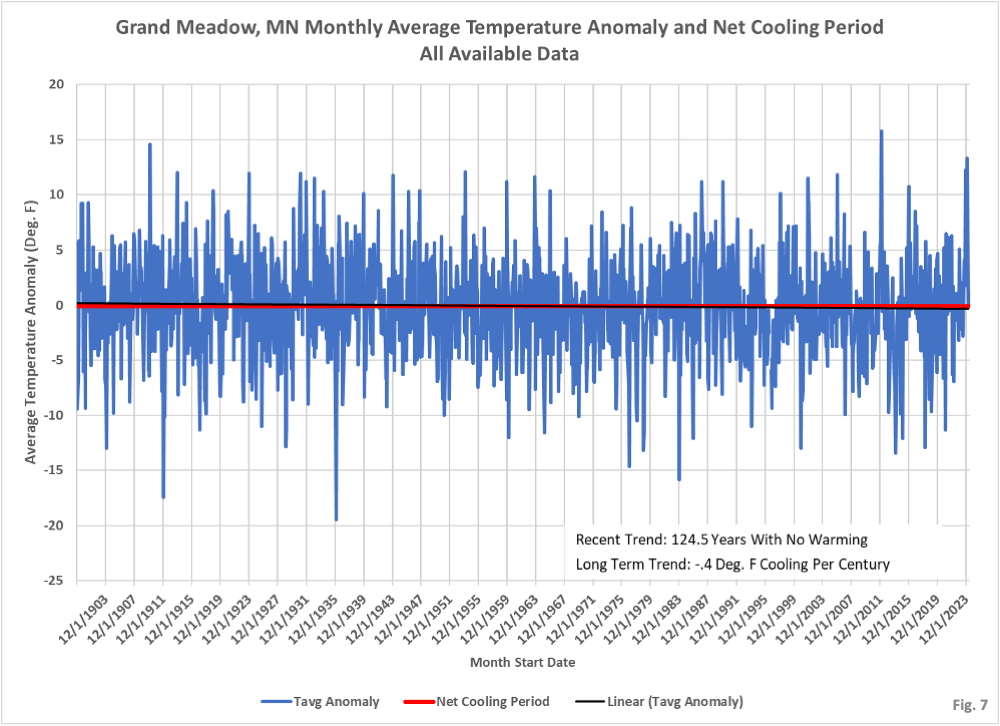
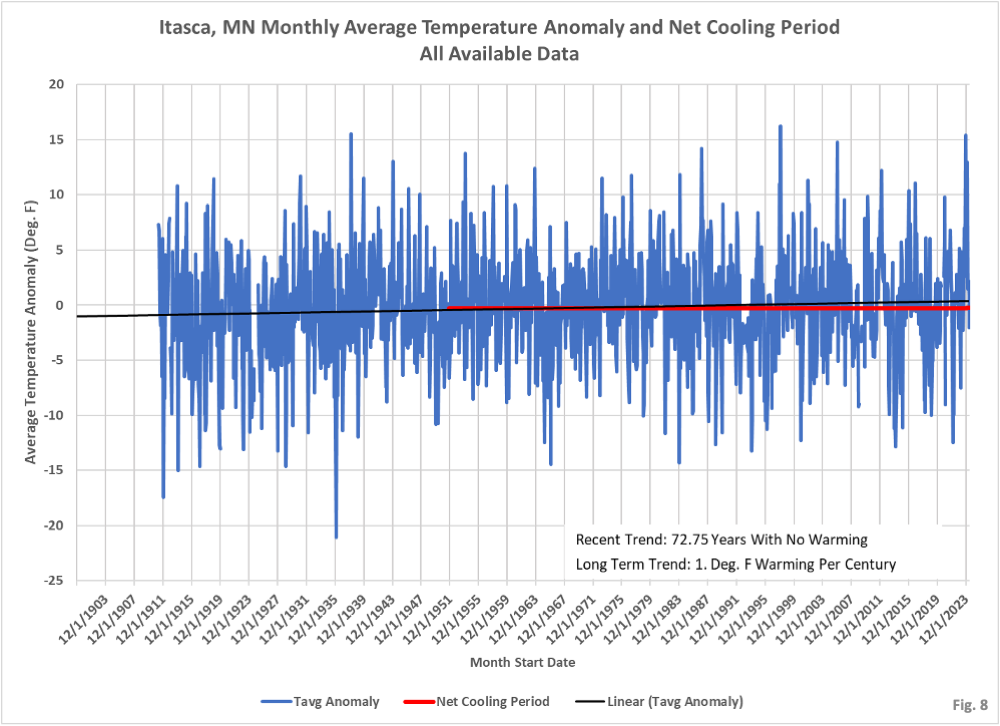
8. The Net Cooling Period is calculated by evaluating how far back from the most recent month that a linear regression has a negative slope, indicating a cooling temperature trend. This is illustrated as the red line on the chart. The overall temperature trend is shown in black, using the built-in Excel linear trend function.
