An update on the per capita unvaxed event rates that we discussed in an earlier post. First, DOH very quickly got back to Dave with the verbatim explanations below. I am not sure about this explanation and it is hard to understand why they wouldn’t put this out publicly when it resulted in such a massive change. The explanation also suggests a very bizarre and convoluted process which is highly subject to error and which calls into question any of the per capita sub-group rates put out by DOH. It also makes you wonder about the accuracy of their identification of breakthru events. Dave is working further on trying to match the DOH calculations, so expect another post. Here is the current update:
DOH’s explanation to Dave is below:
“Good Afternoon Dave –
In response to your message, data on vaccinations are dynamic and the facilities that report vaccinations to MIIC are continually reviewing and updating their numbers. Usually, these changes result in small shifts (e.g. a person’s exact vaccination date is updated to a slightly different time, a duplicate vaccination record is removed). In some instances, organizations will perform data cleaning by briefly clearing all of their vaccination reports and then resubmitting them with the cleaned information. In this instance, it appears we pulled the data at precisely the wrong moment resulting in a large discrepancy in early vaccination numbers which had a trickledown effect on the cumulative vaccination counts which then impacted the case rates. The data in MIIC have since been updated and will be reflected in the next VBT web update on Monday, March 7th.”
And here is Dave’s explanation of the problem as he saw it, with accompanying chart of the changes. I think you can see from Dave’s notes that the DOH explanation makes no real sense:
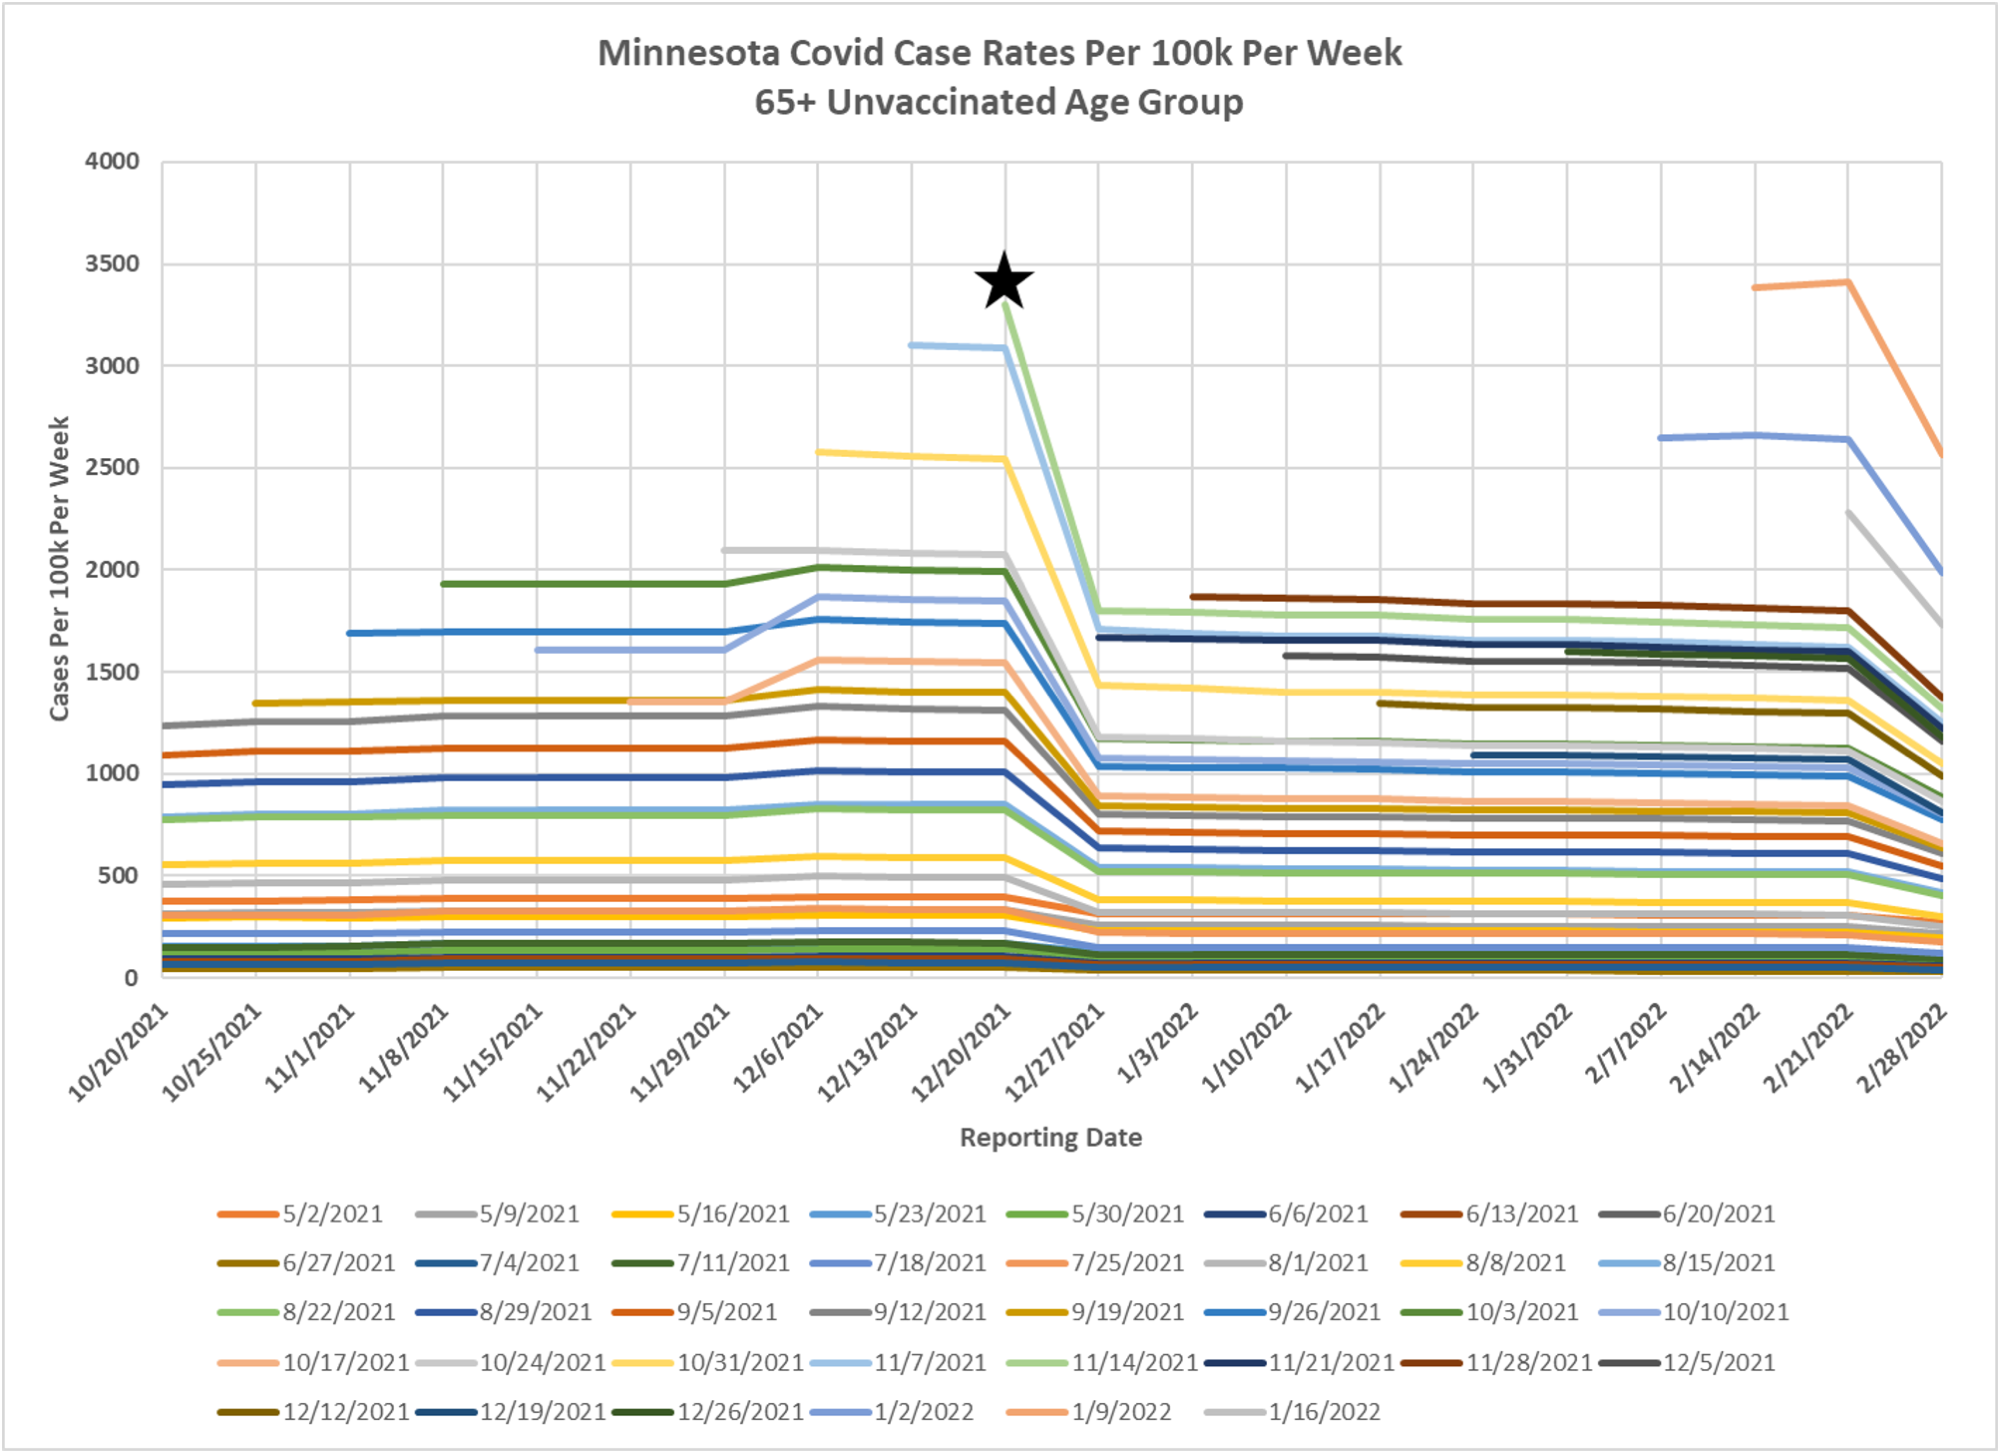
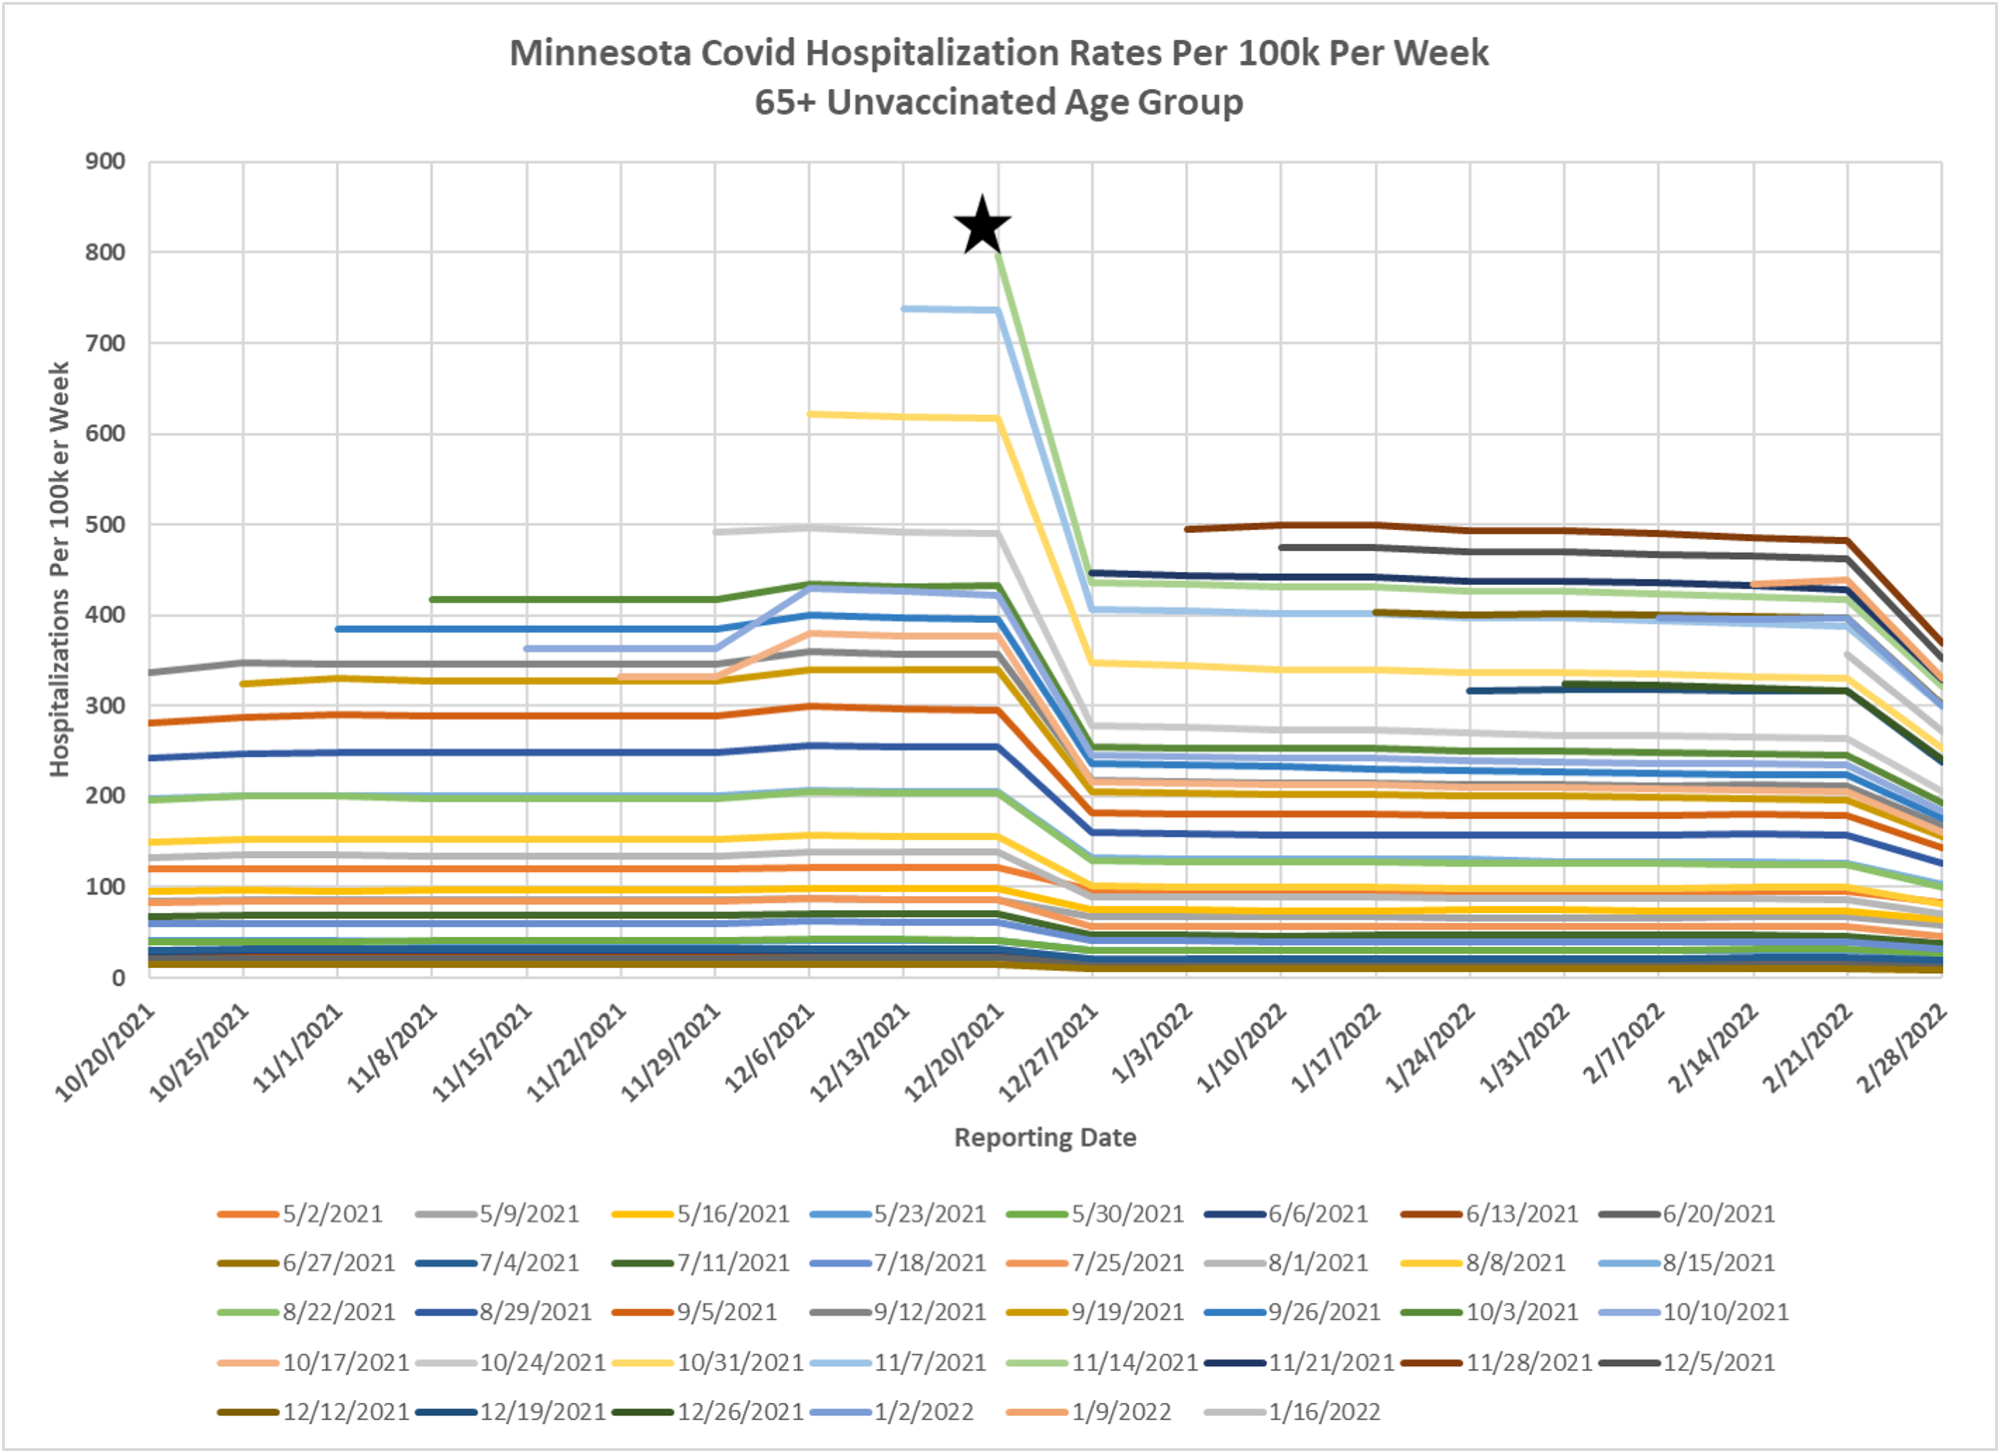
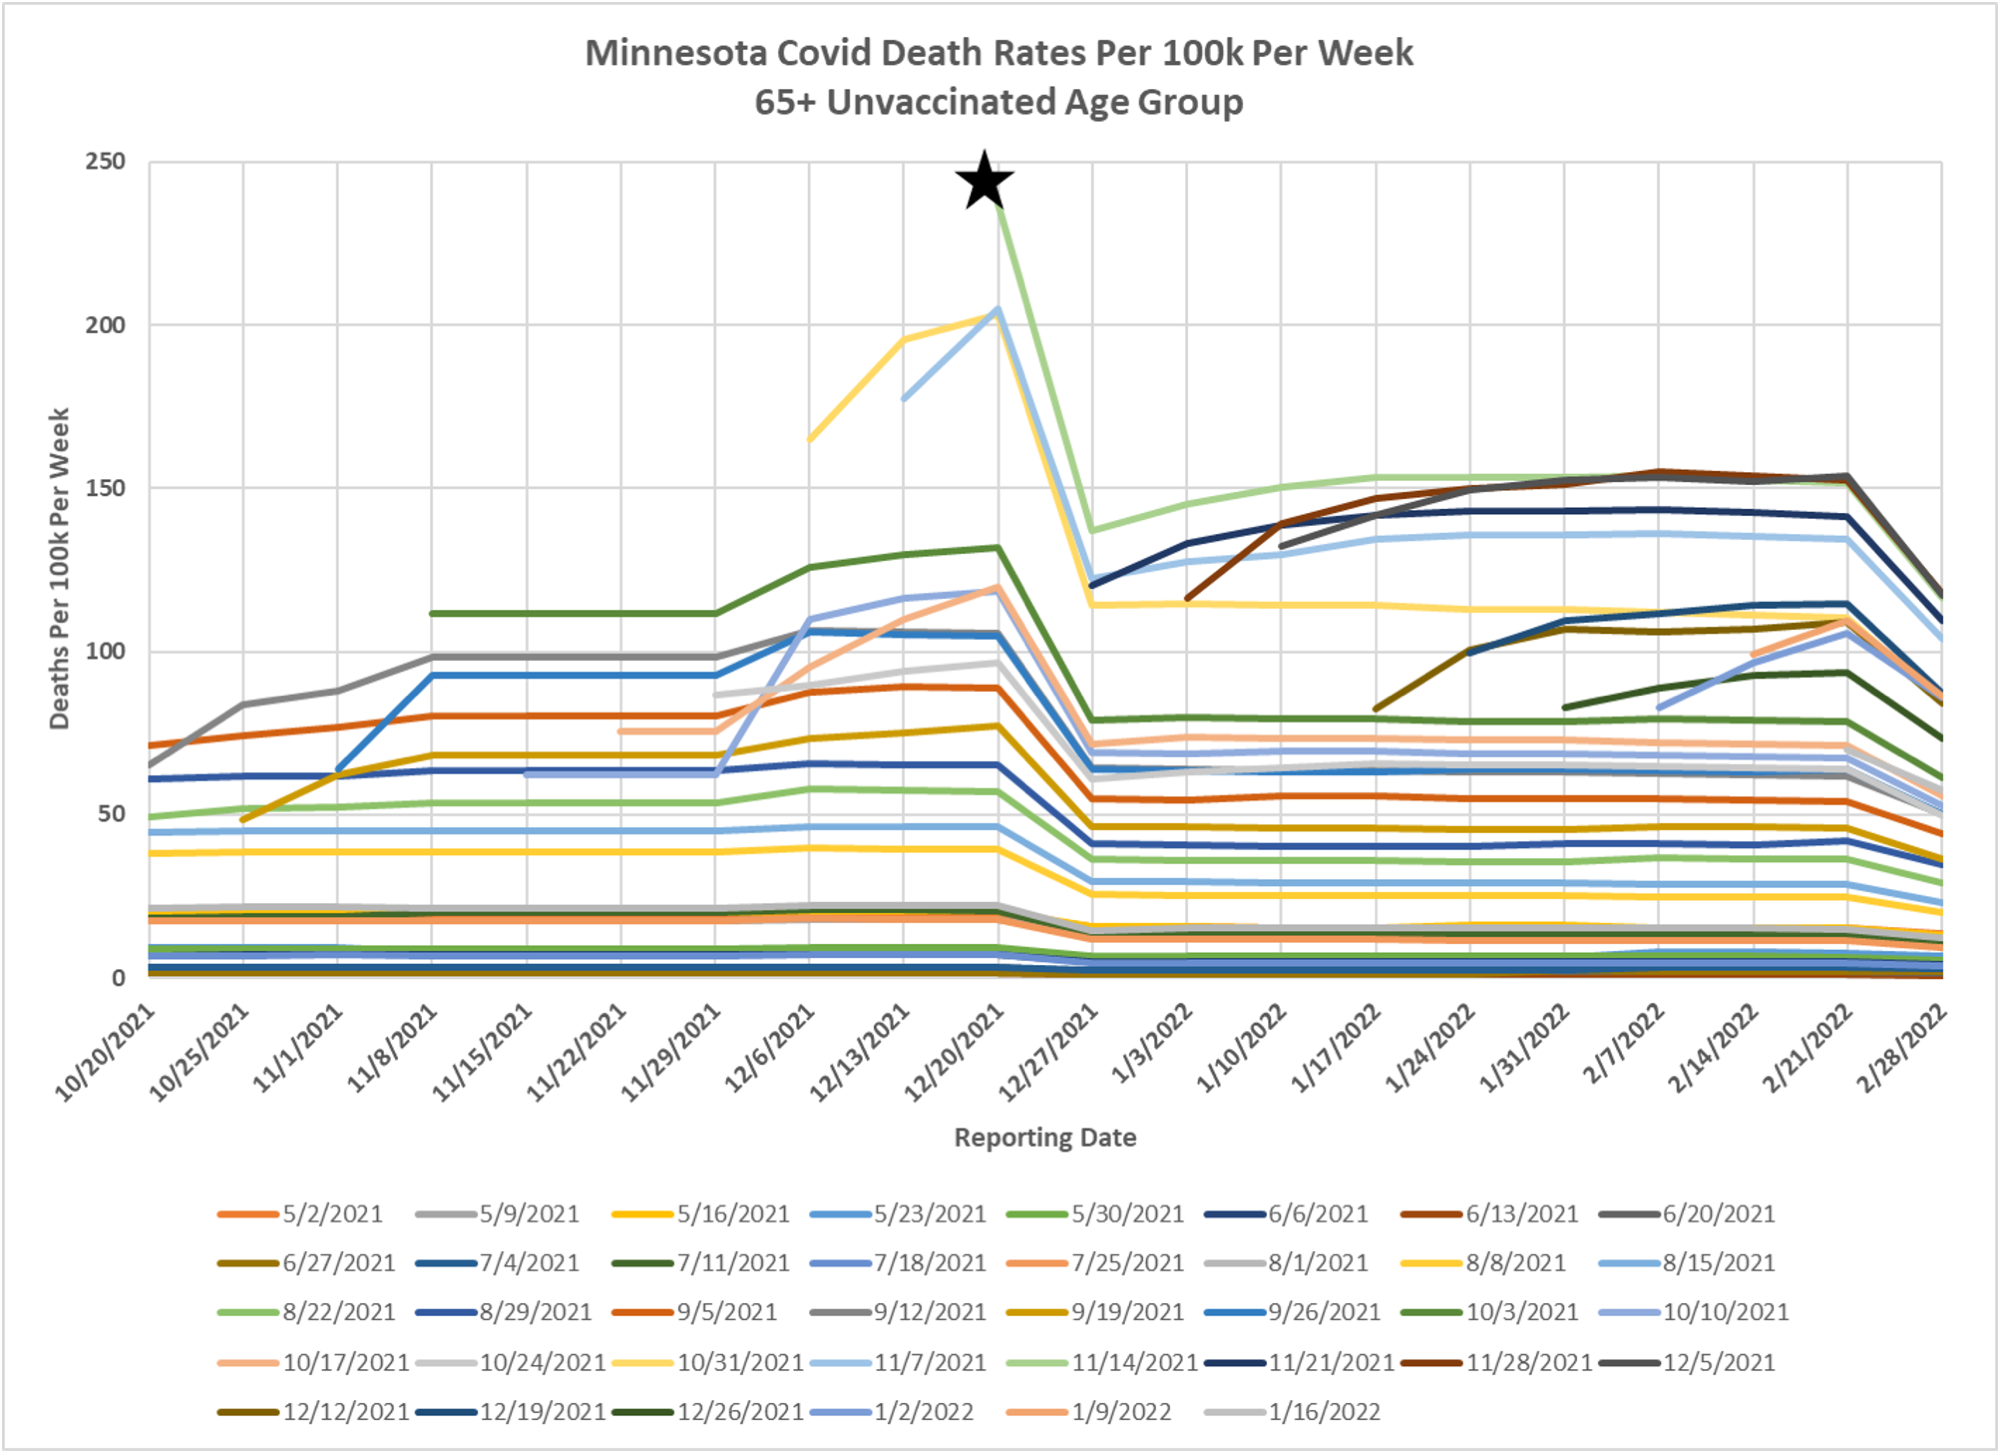
- The rates per 100k for cases, hospitalizations, and deaths for the 65+ unvaccinated age group. These rates are taken directly from the date file vbtcirates.xlsx, found on the Minnesota Department of Health (MDH) COVID-19 Vaccine Breakthrough Weekly Update, https://www.health.state.mn.
us/diseases/coronavirus/stats/ vbt.html#vbta1. - Each line on the following charts is the published rate per 100k for the 65+ unvaccinated age group for a given week. Every Monday MDH updates the breakthrough data retroactively, and each week’s data point is displayed from left to right as it is updated each week. In our notes we used the data for the week of 11/14/2021 as an example. The curves showing the rates per 100k for case, hospitalizations, and deaths are marked with a black star on the charts.
- We can see that all of the rates were dramatically lowered on 12/27/2021. This was due to a major revision that MDH made to the population size of the unvaccinated population. In the Fall of 2021 we had attempted, without success, to replicate the rates per 100k that MDH published on the Vaccine Update web page. After a tremendous amount of work, and submitting several Data Practices Act Requests to get the underlying data MDH used to generate their rates, we discovered that MDH was using an incorrect population size for Minnesota, which caused the unvaccinated rates to be incorrect. Although MDH did not disclose the reason for their revisions, we feel confident that our discovery of MDH’s use of incorrect population size is the root cause.
- Another comprehensive lowering of rates per 100k occurred on 2/28/2022. This revision was smaller than the 12/27/2021 revision, but affected every data point back the 5/2/2021, the first date published by MDH in this data set. We asked MDH the cause of the 2/28/2022 revision and were informed that it is due to some data cleanup being done to the vaccination data base, and that more changes will be expected next week on 3/7/2022.
- The net result of the revisions is a huge lowering of the case, hospitalization, and death rates per 100k for the unvaccinated. In our example for 11/14/2021, cases per 100k as published on 2/28/2022 were 60% lower than the initial rate published. Similarly, hospitalizations for the week of 11/14/2021 were also reduced by 60% from initial publication until the rate published on 2/28/2022. Deaths per 100k were reduced by 51% from initial publication to 2/28/2022.
 The Healthy Skeptic is a website about the health care system, and is written by Kevin Roche, who has many years of experience working in the health industry. Mr. Roche is available to assist health care companies through consulting arrangements through Roche Consulting, LLC and may be reached at
  RSS - Posts
Is it possible that they are now just covering their asses, anticipating future investigations and lawsuits? Perhaps they know they have been over-inflating these numbers for months and now they are trying to backtrack?
This should be headlined in the Star Trib! Please, please get it there. Thank you both.
I find the DOH explanation interesting. And I think I recognize the author’s writing style. I believe it was written by a person who used to write articles for Pravda.
No government agency is going to release any data that contradicts the narrative that they did a great job of managing a global pandemic. Also, that most of the ‘damage’ was done by people who refused to follow their orders and/or refused their experimental mRNA product. There will be excuses, data refreshes, updates with finger pointing, etc. as long as they are in power. You can bet some poor soul at the MN DOH had a good reaming and maybe even a change in duties for releasing an honest report.
I wonder how many people in the vaxxed data set had their doses more that 6 months ago and no booster? I think it’s very clear by now that they are functionally ‘unvaxxed’. What happens to the numbers if you add this reality and drop them from the counts?
So…. when do you think Mn DOH will update the breakthroughs web page? It will be interesting to see the updated weekly age adjusted rates graphic! I picture everyone at DOH running around the office with their proverbial “…. …. pants on fire”
probably tomorrow