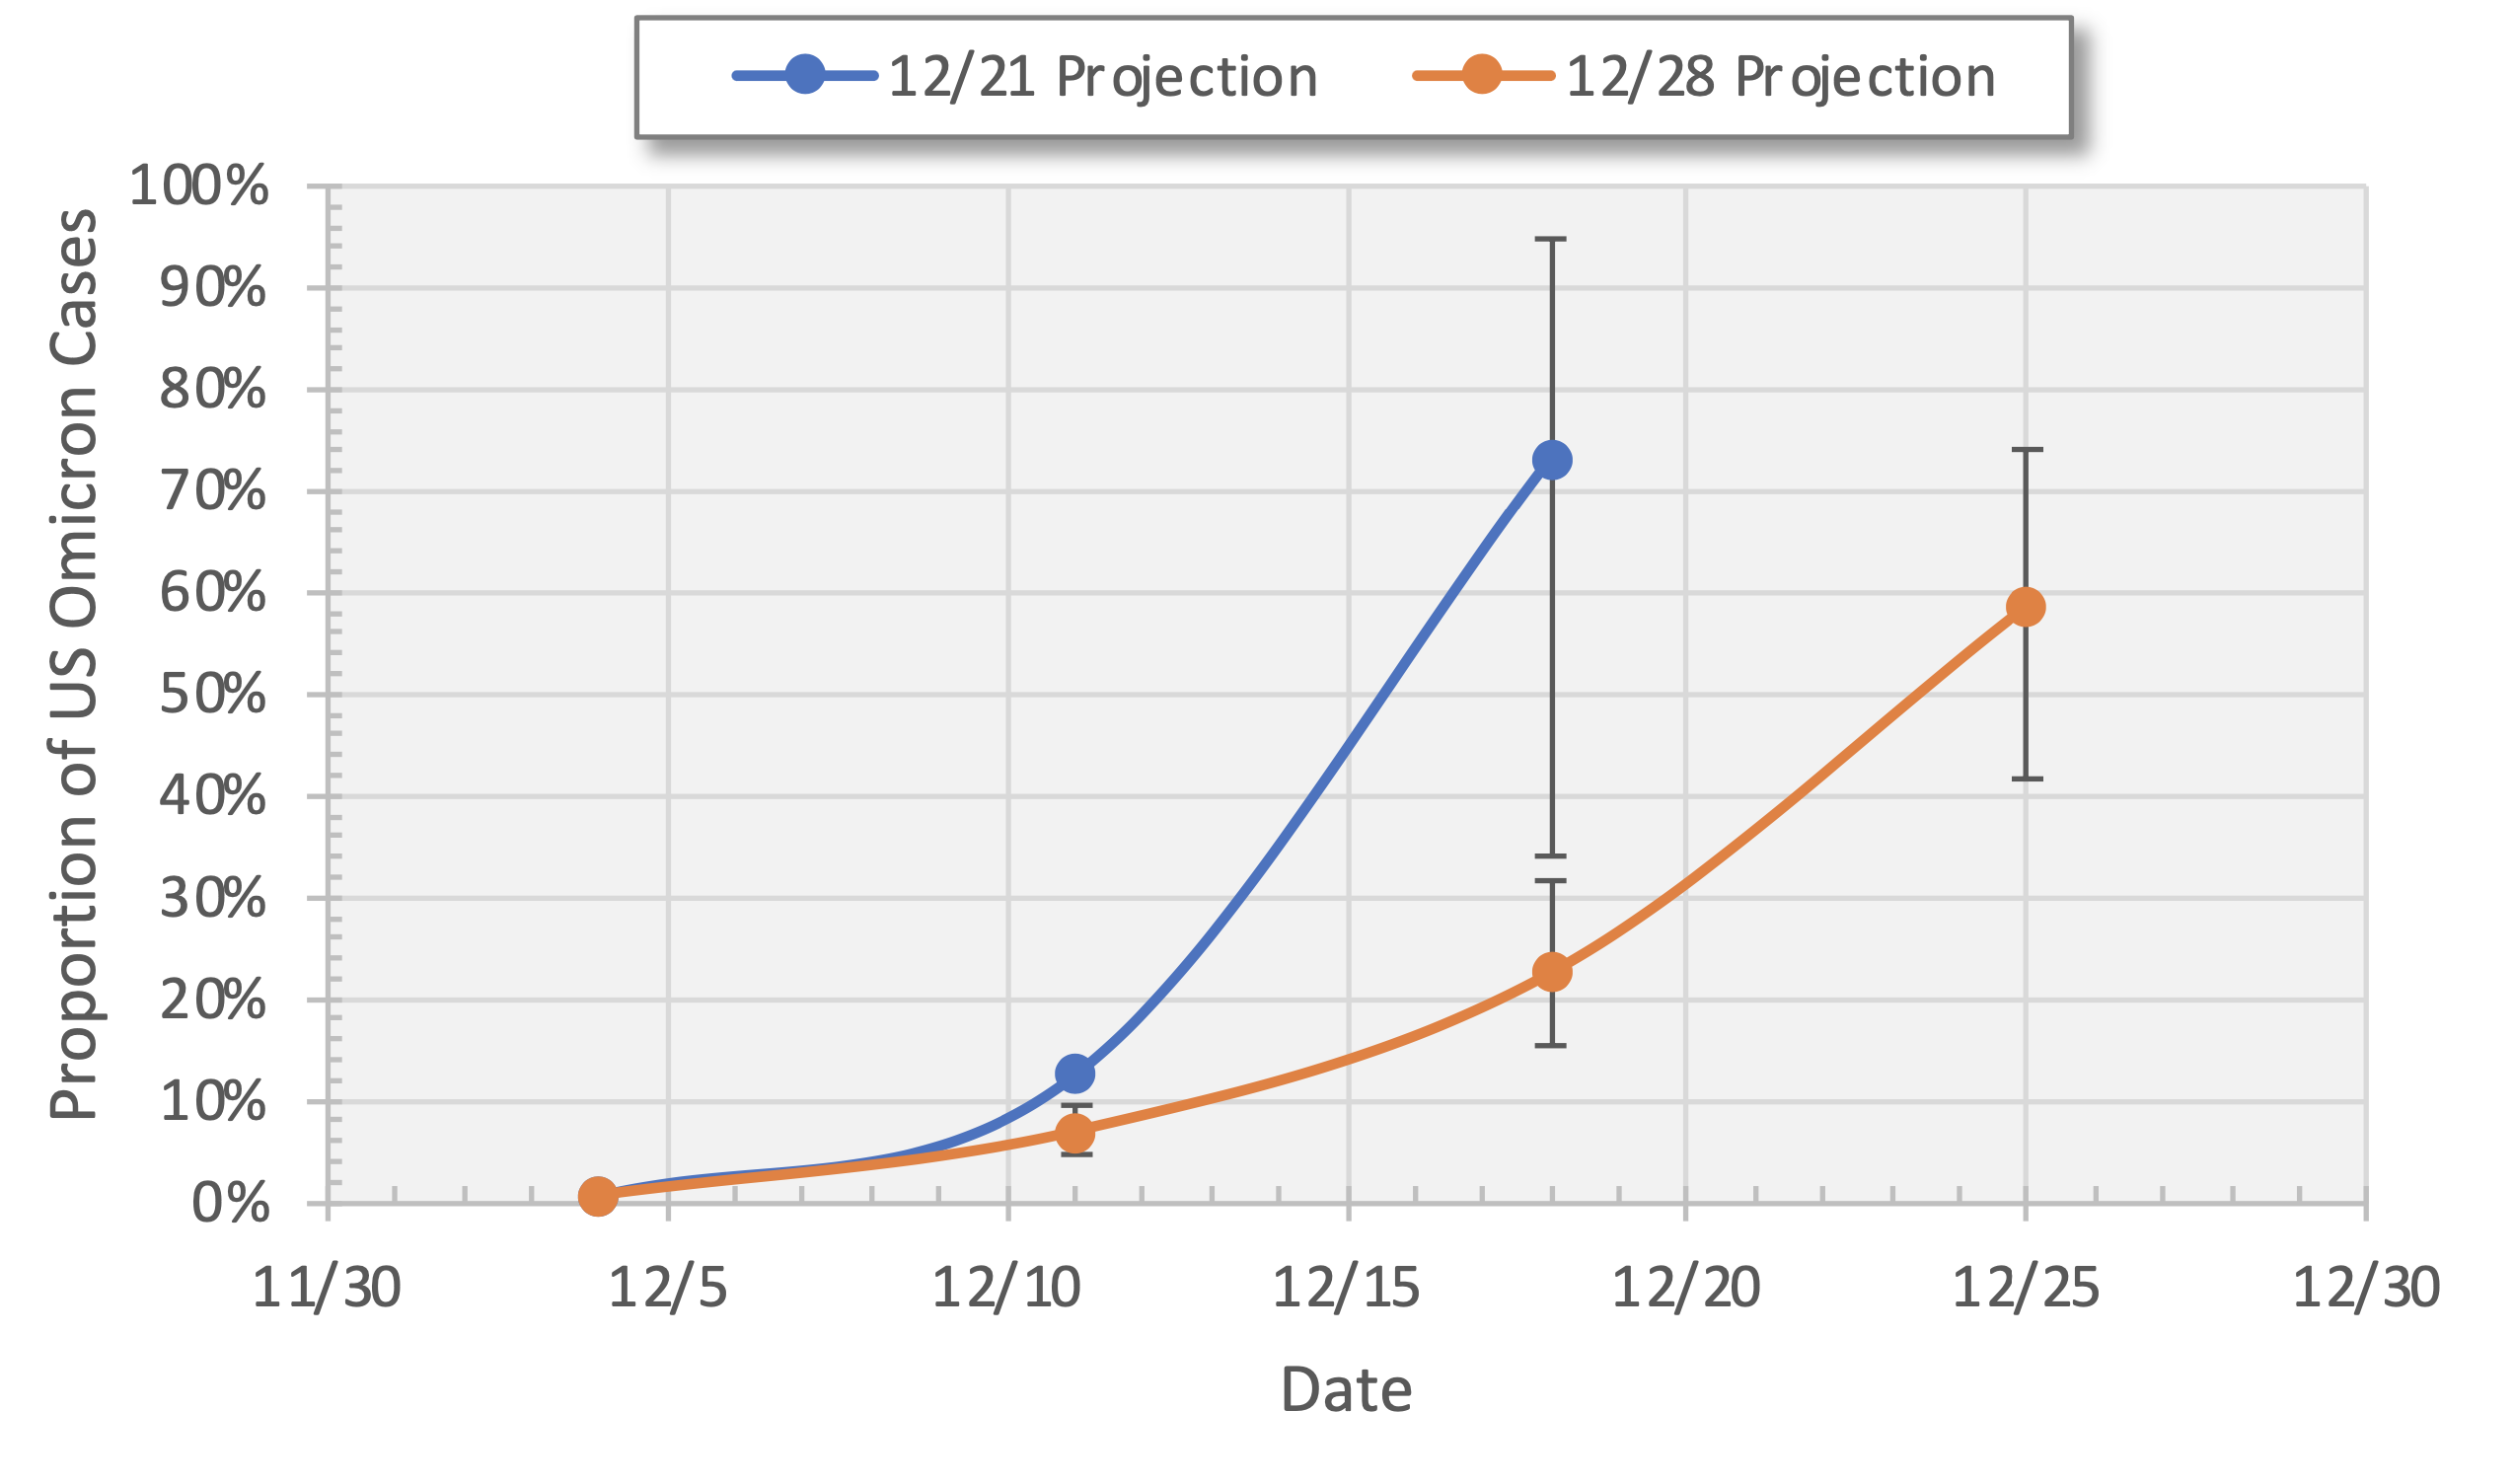
A reader sent me the graph below. Joining in the CV-19 terrorism is a full-time preoccupation for the CDC. This includes issuing dire forecasts that later are pulled back. In this case it relates to how fast the Moronic variant was spreading. Within the space of a week, CDC provided a massive revision of its estimate of spread, with a substantial reduction. Gives you a lot of confidence in the agencies statistical and analytic capabilities.

A) has the CDC left the prior projection up on the website for comparison?
B) has the CDC left any of the prior projections up on the website for comparison?
I could be wrong, but my recollection is that none of the prior projections reflected any reduction in growth due to the normal waves that occur in every pandemic. The projections were always up, up and up. A good example was the famous ferguson projection
Another epic modeling failure?