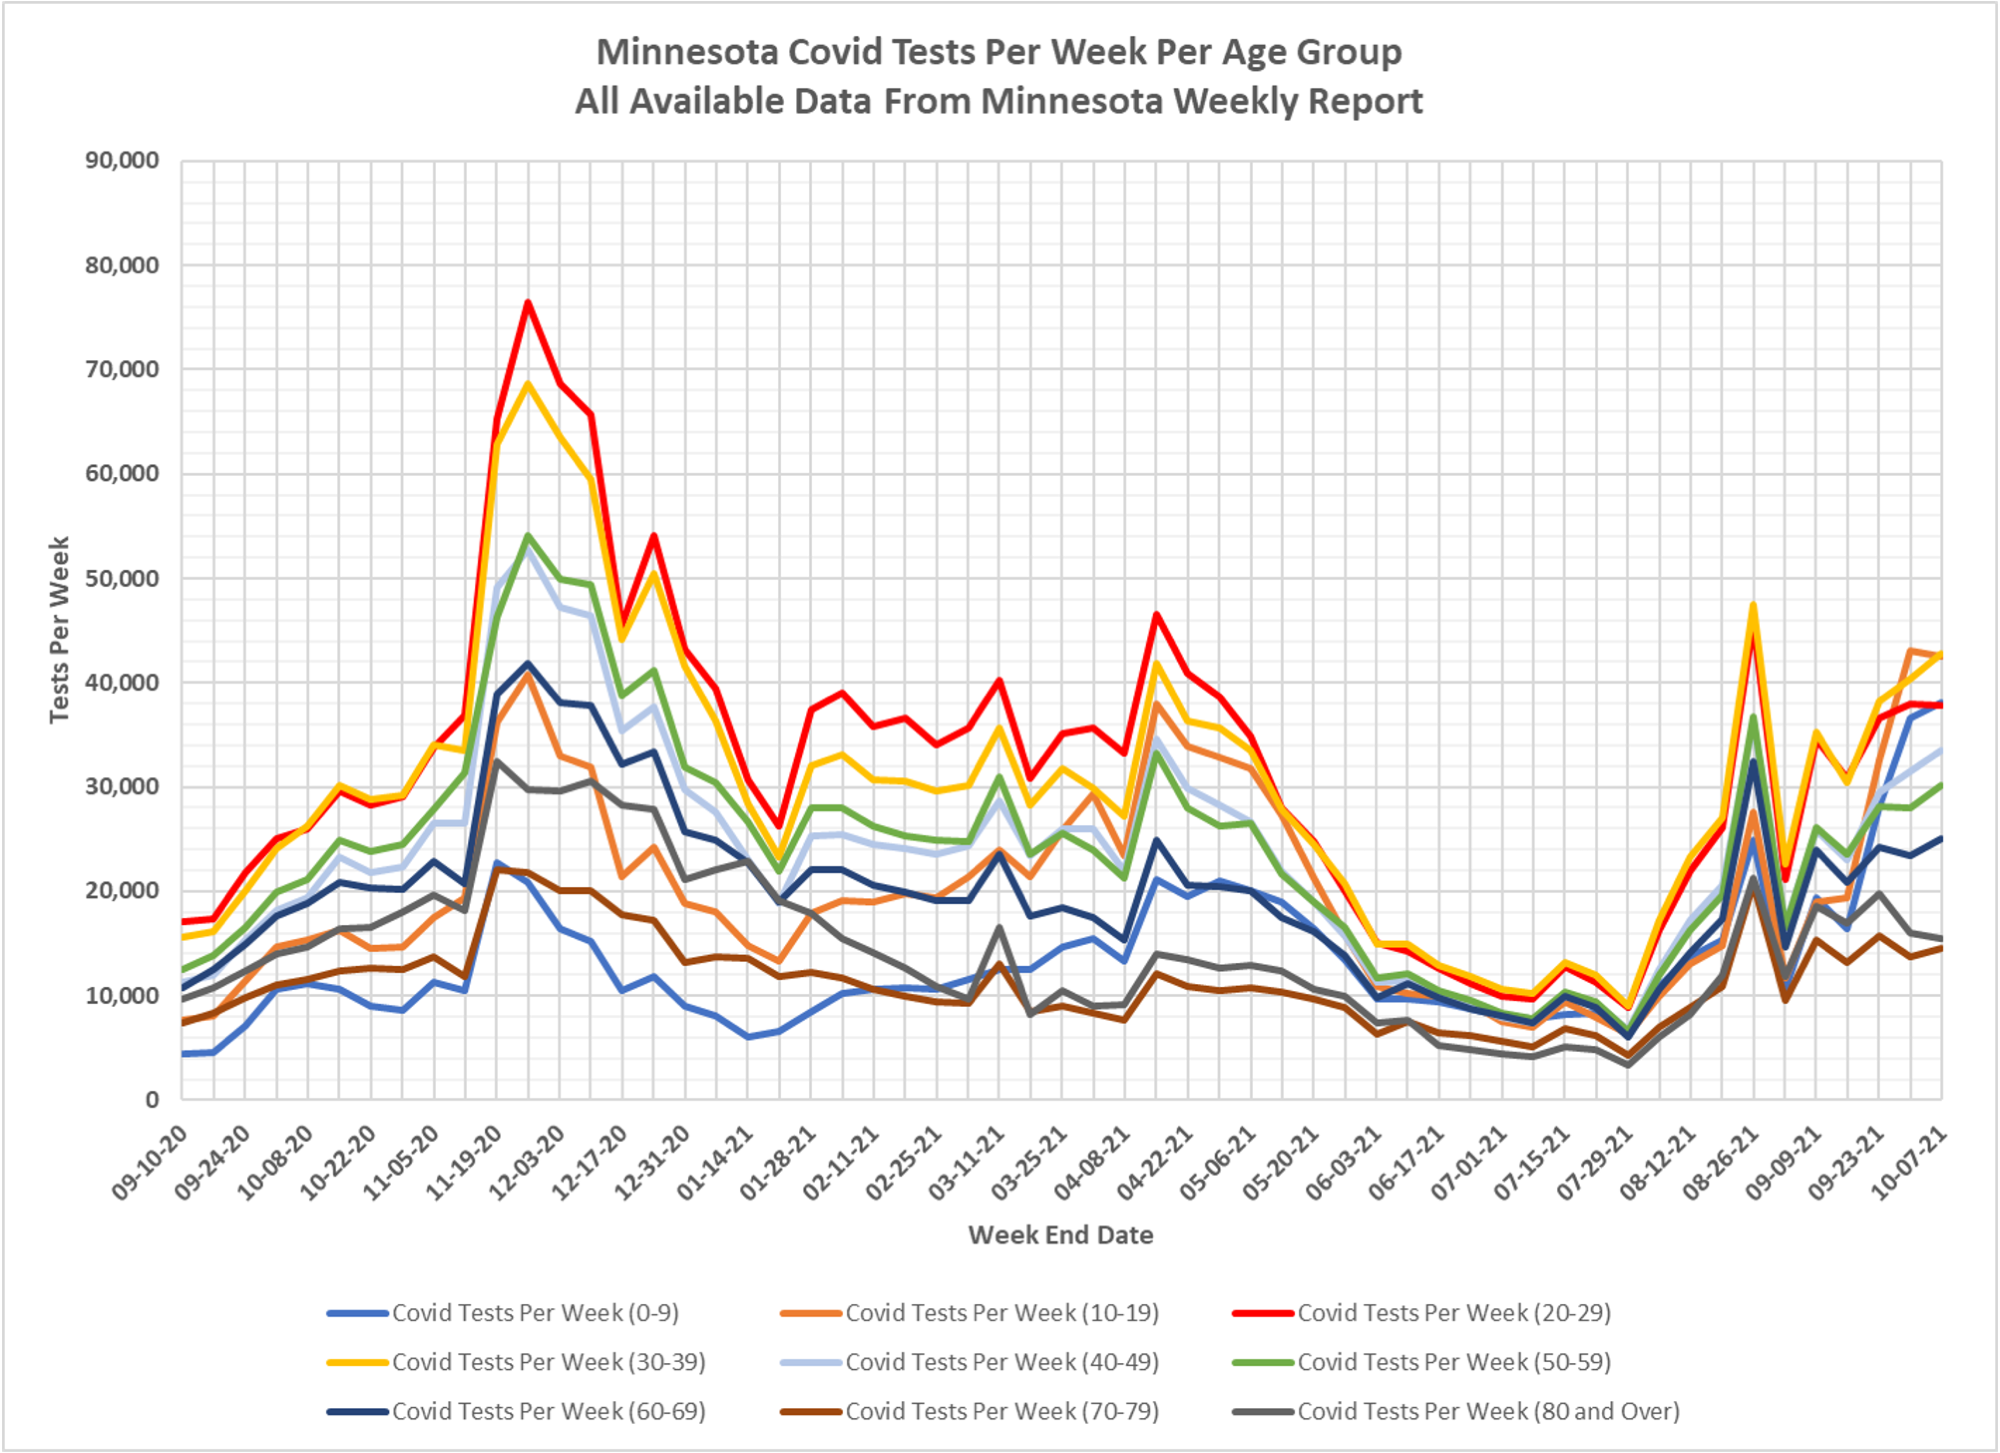
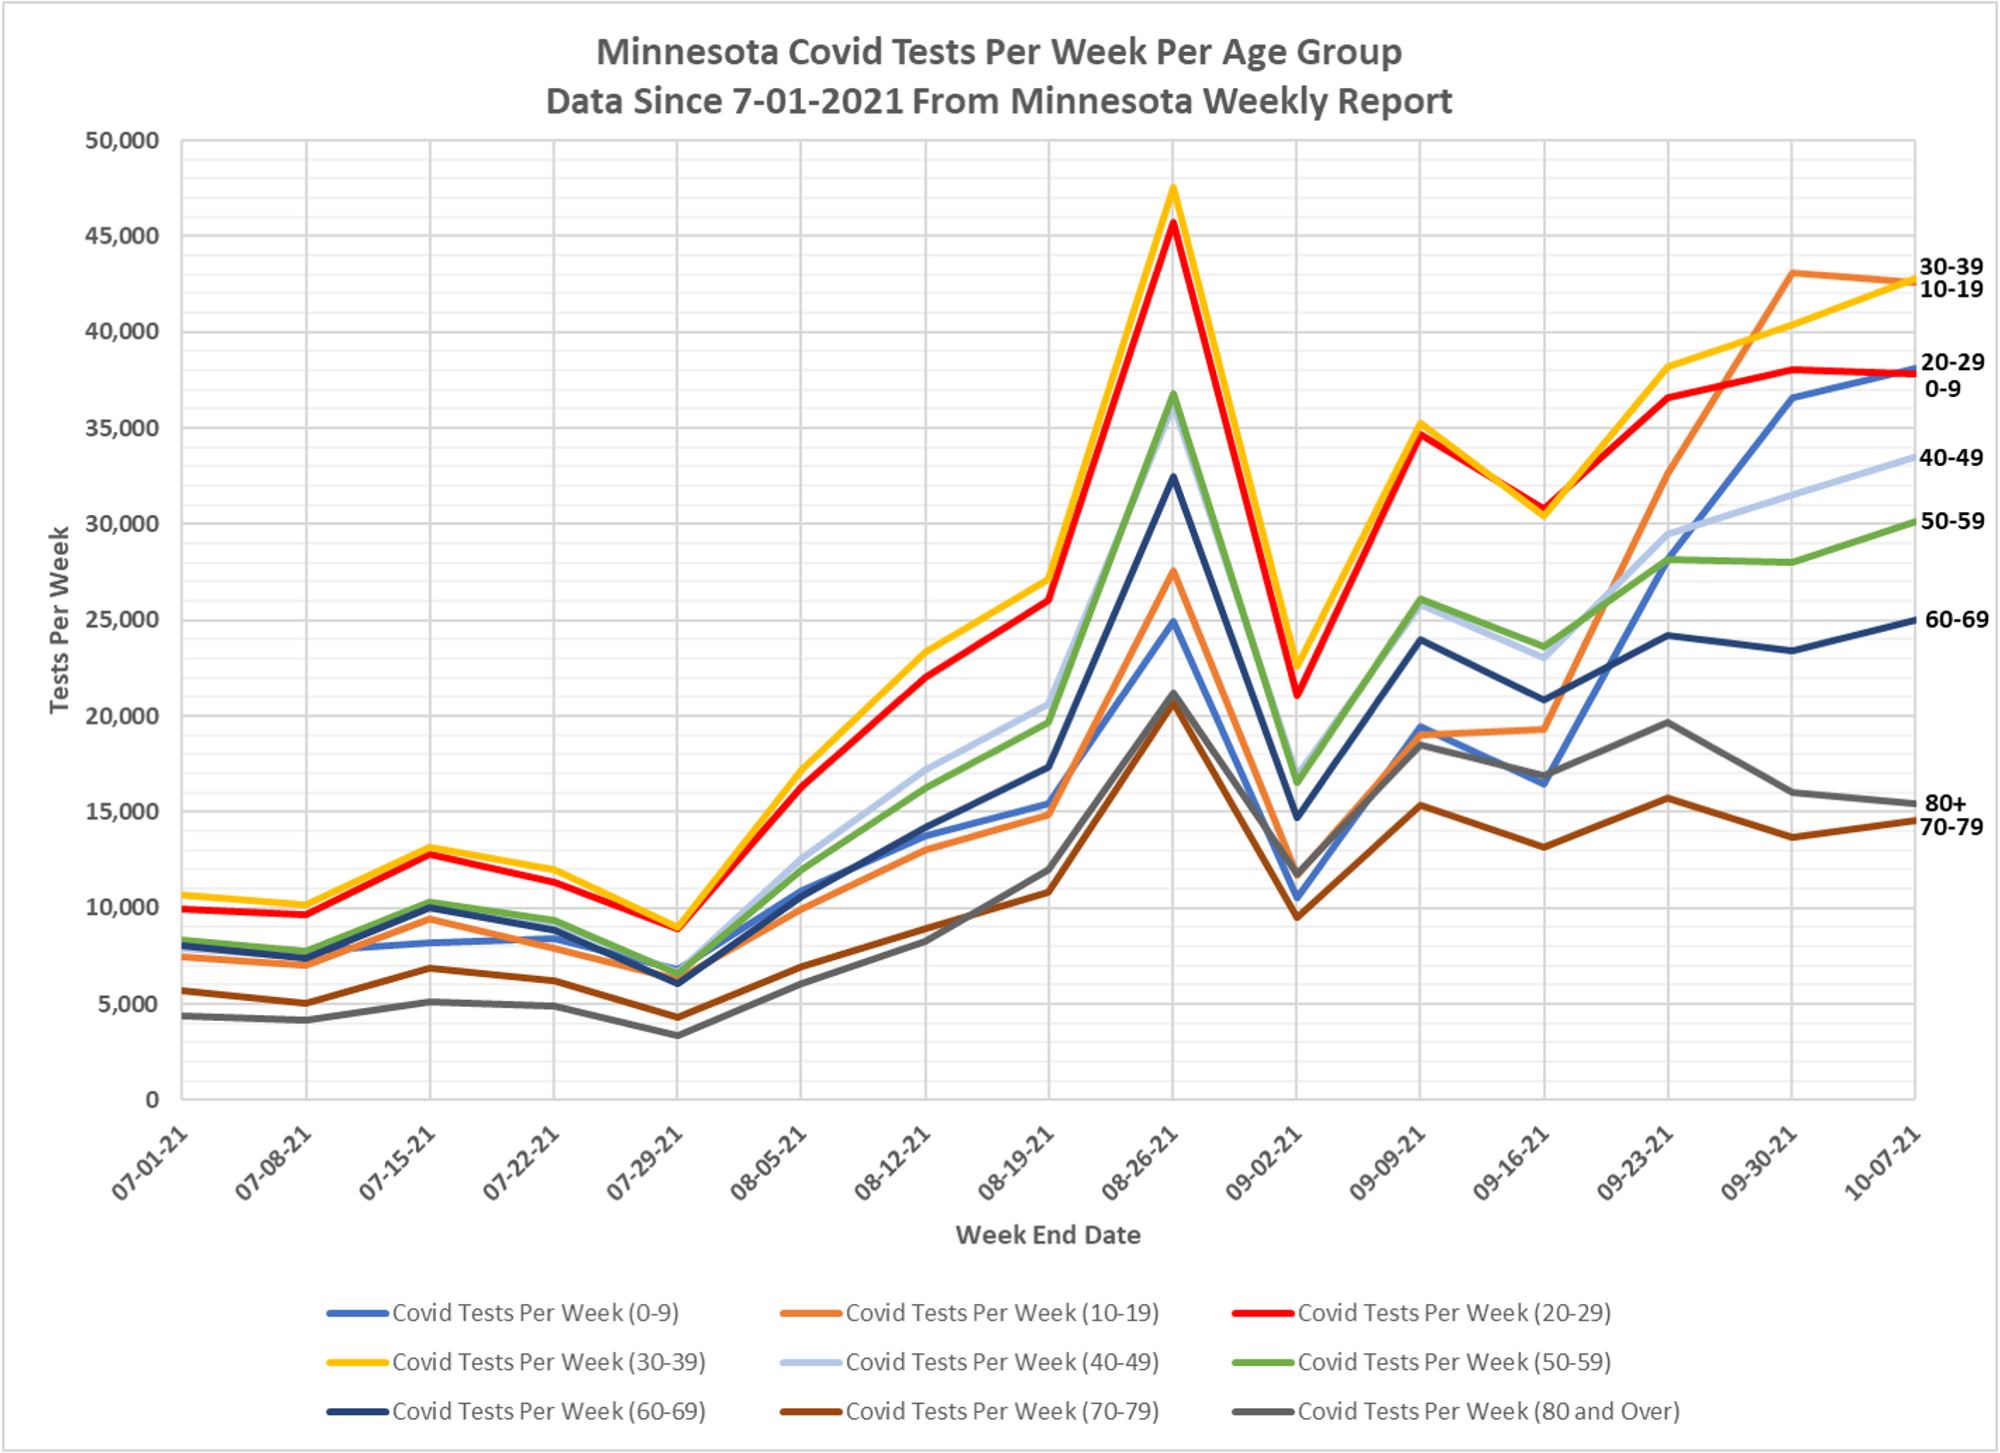
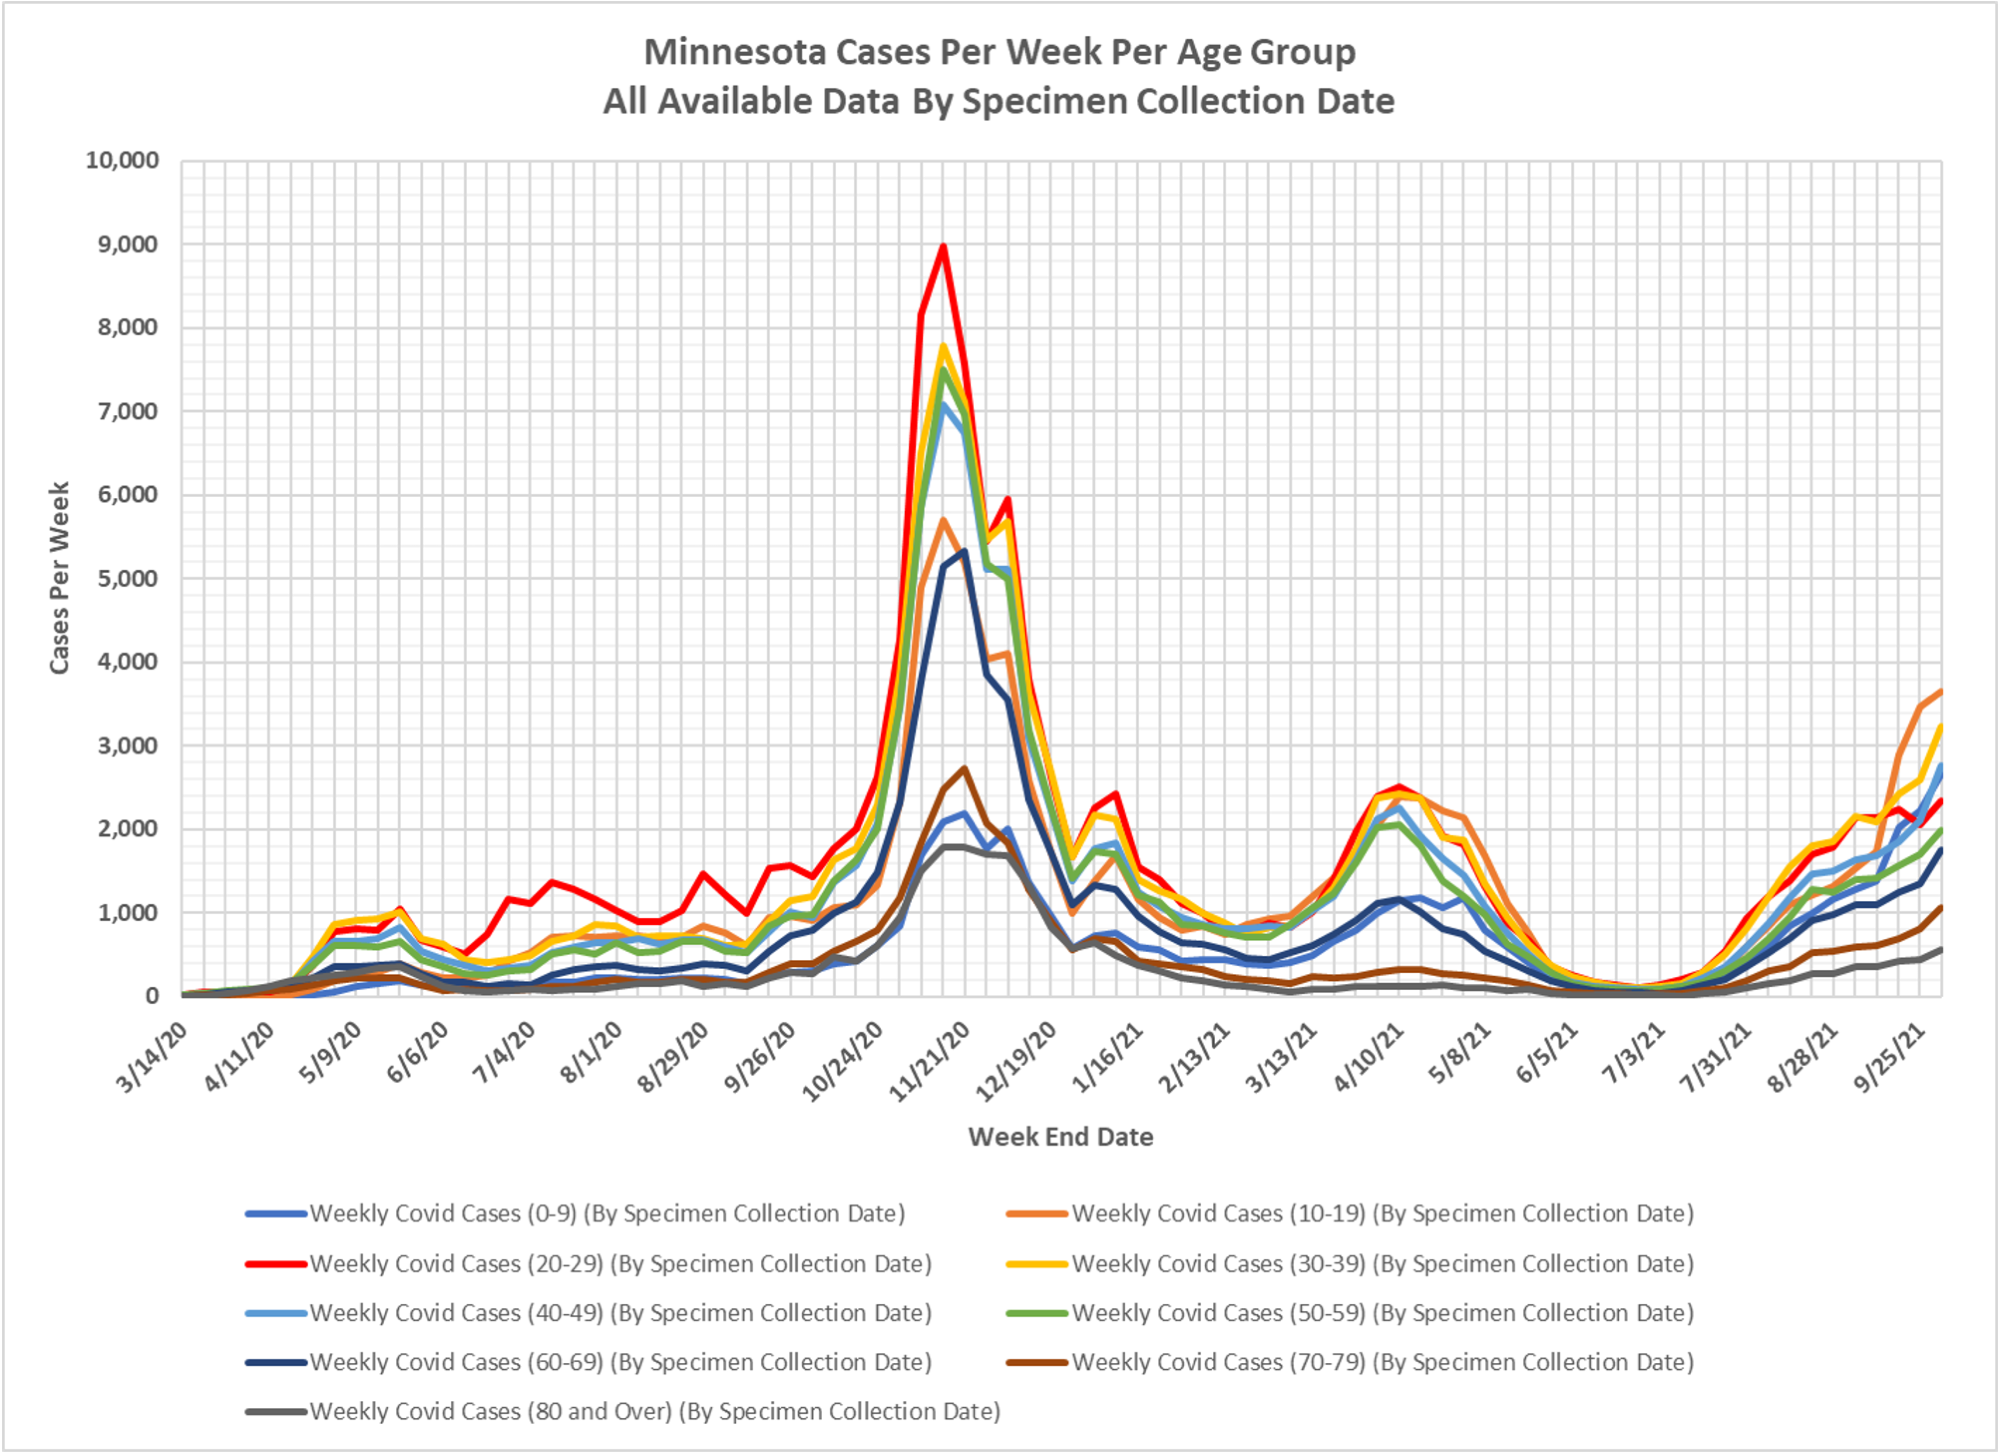
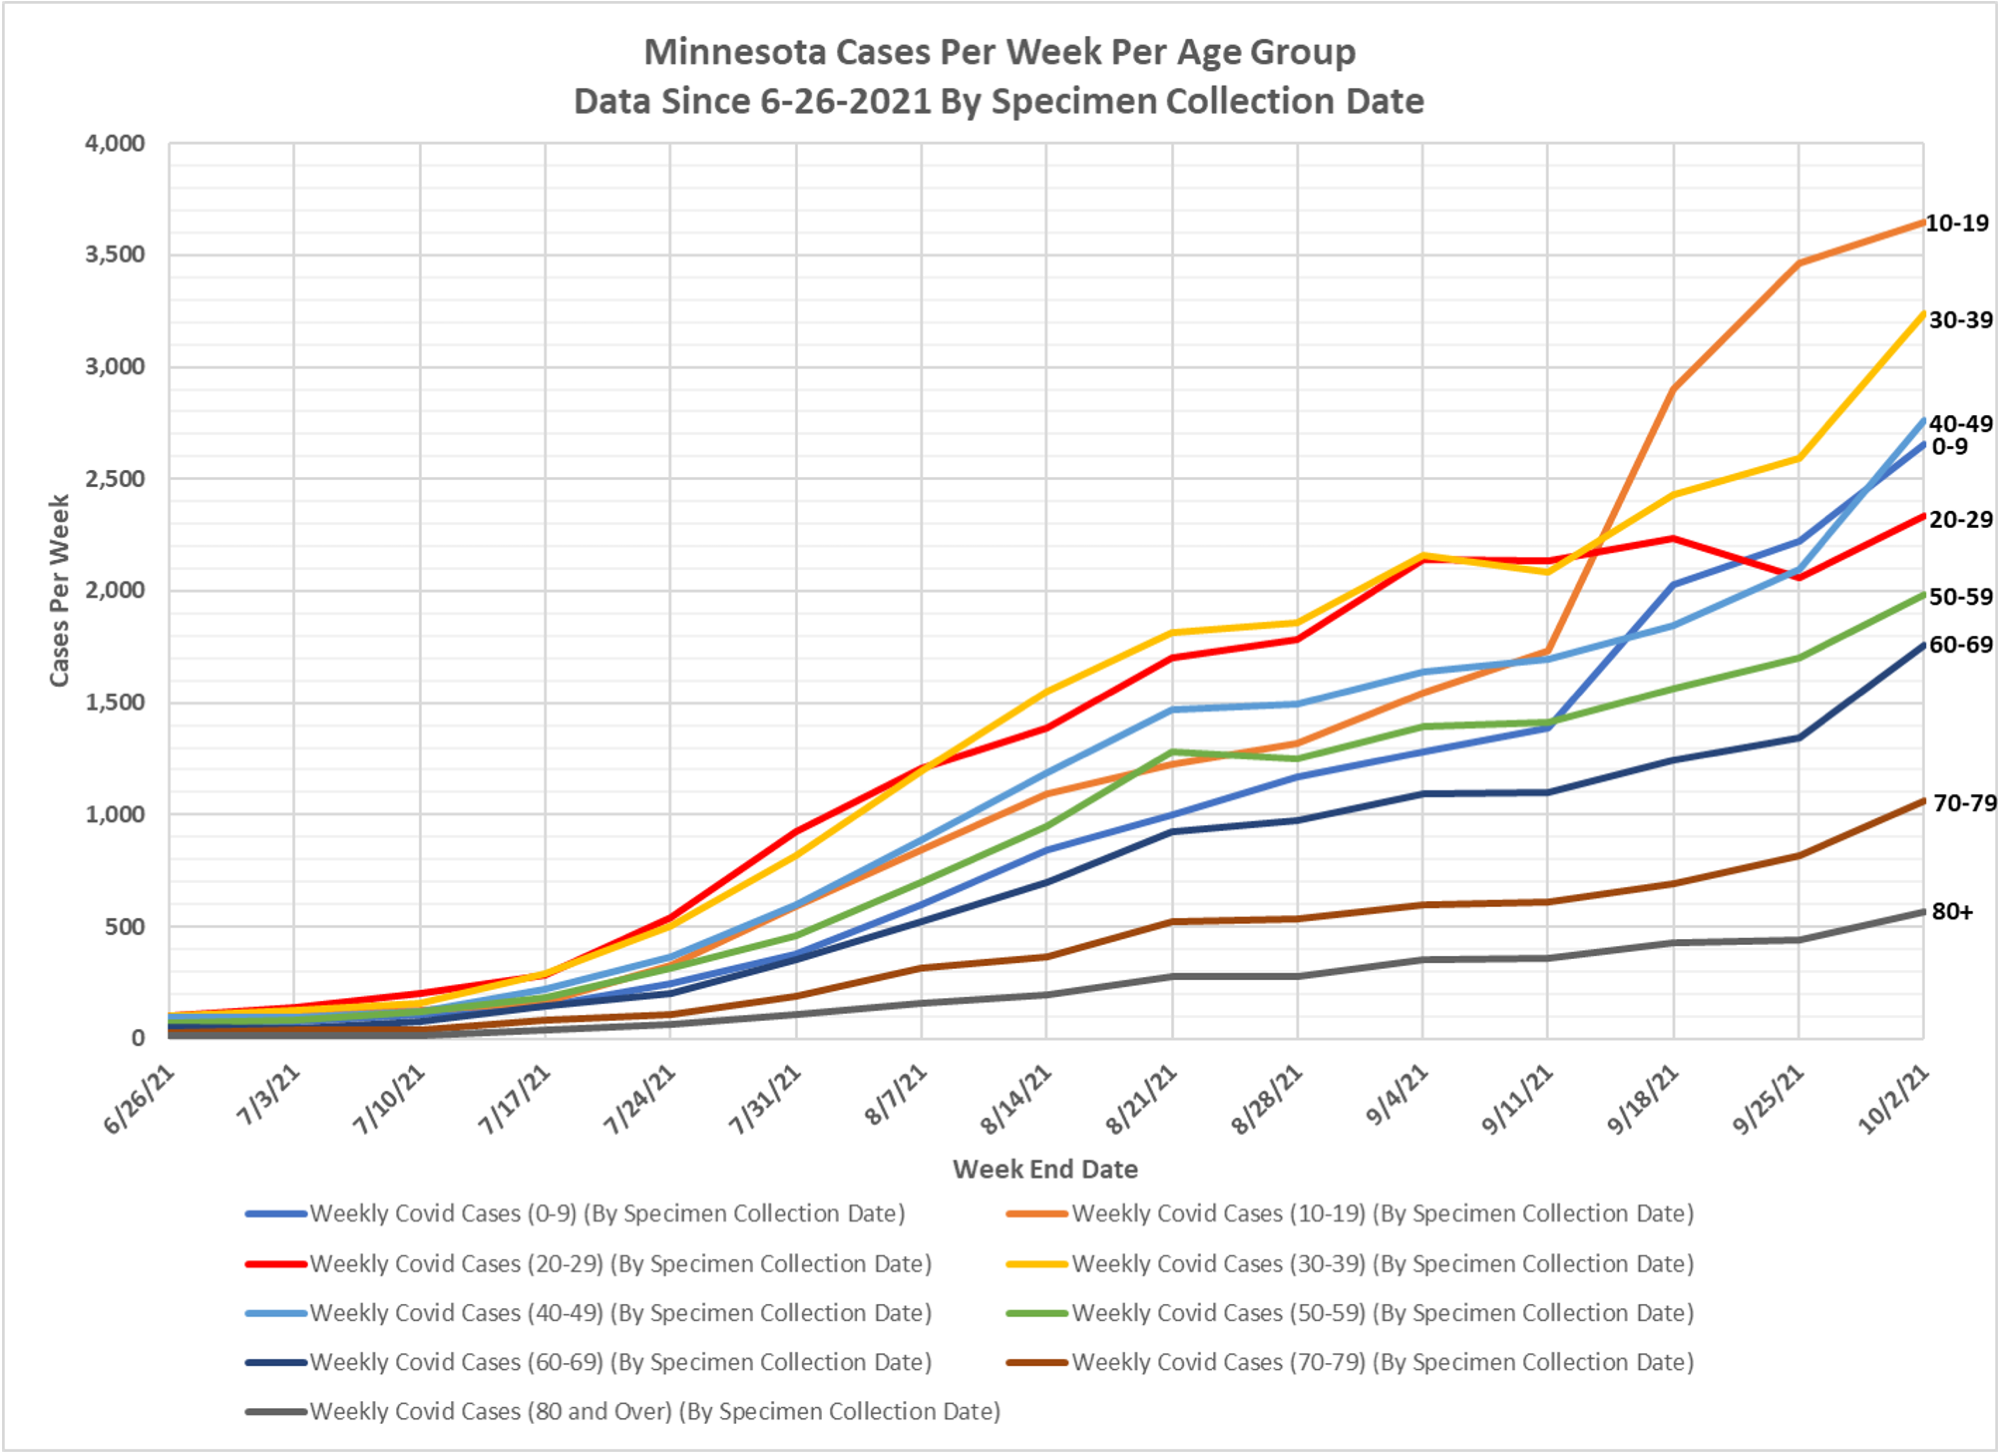
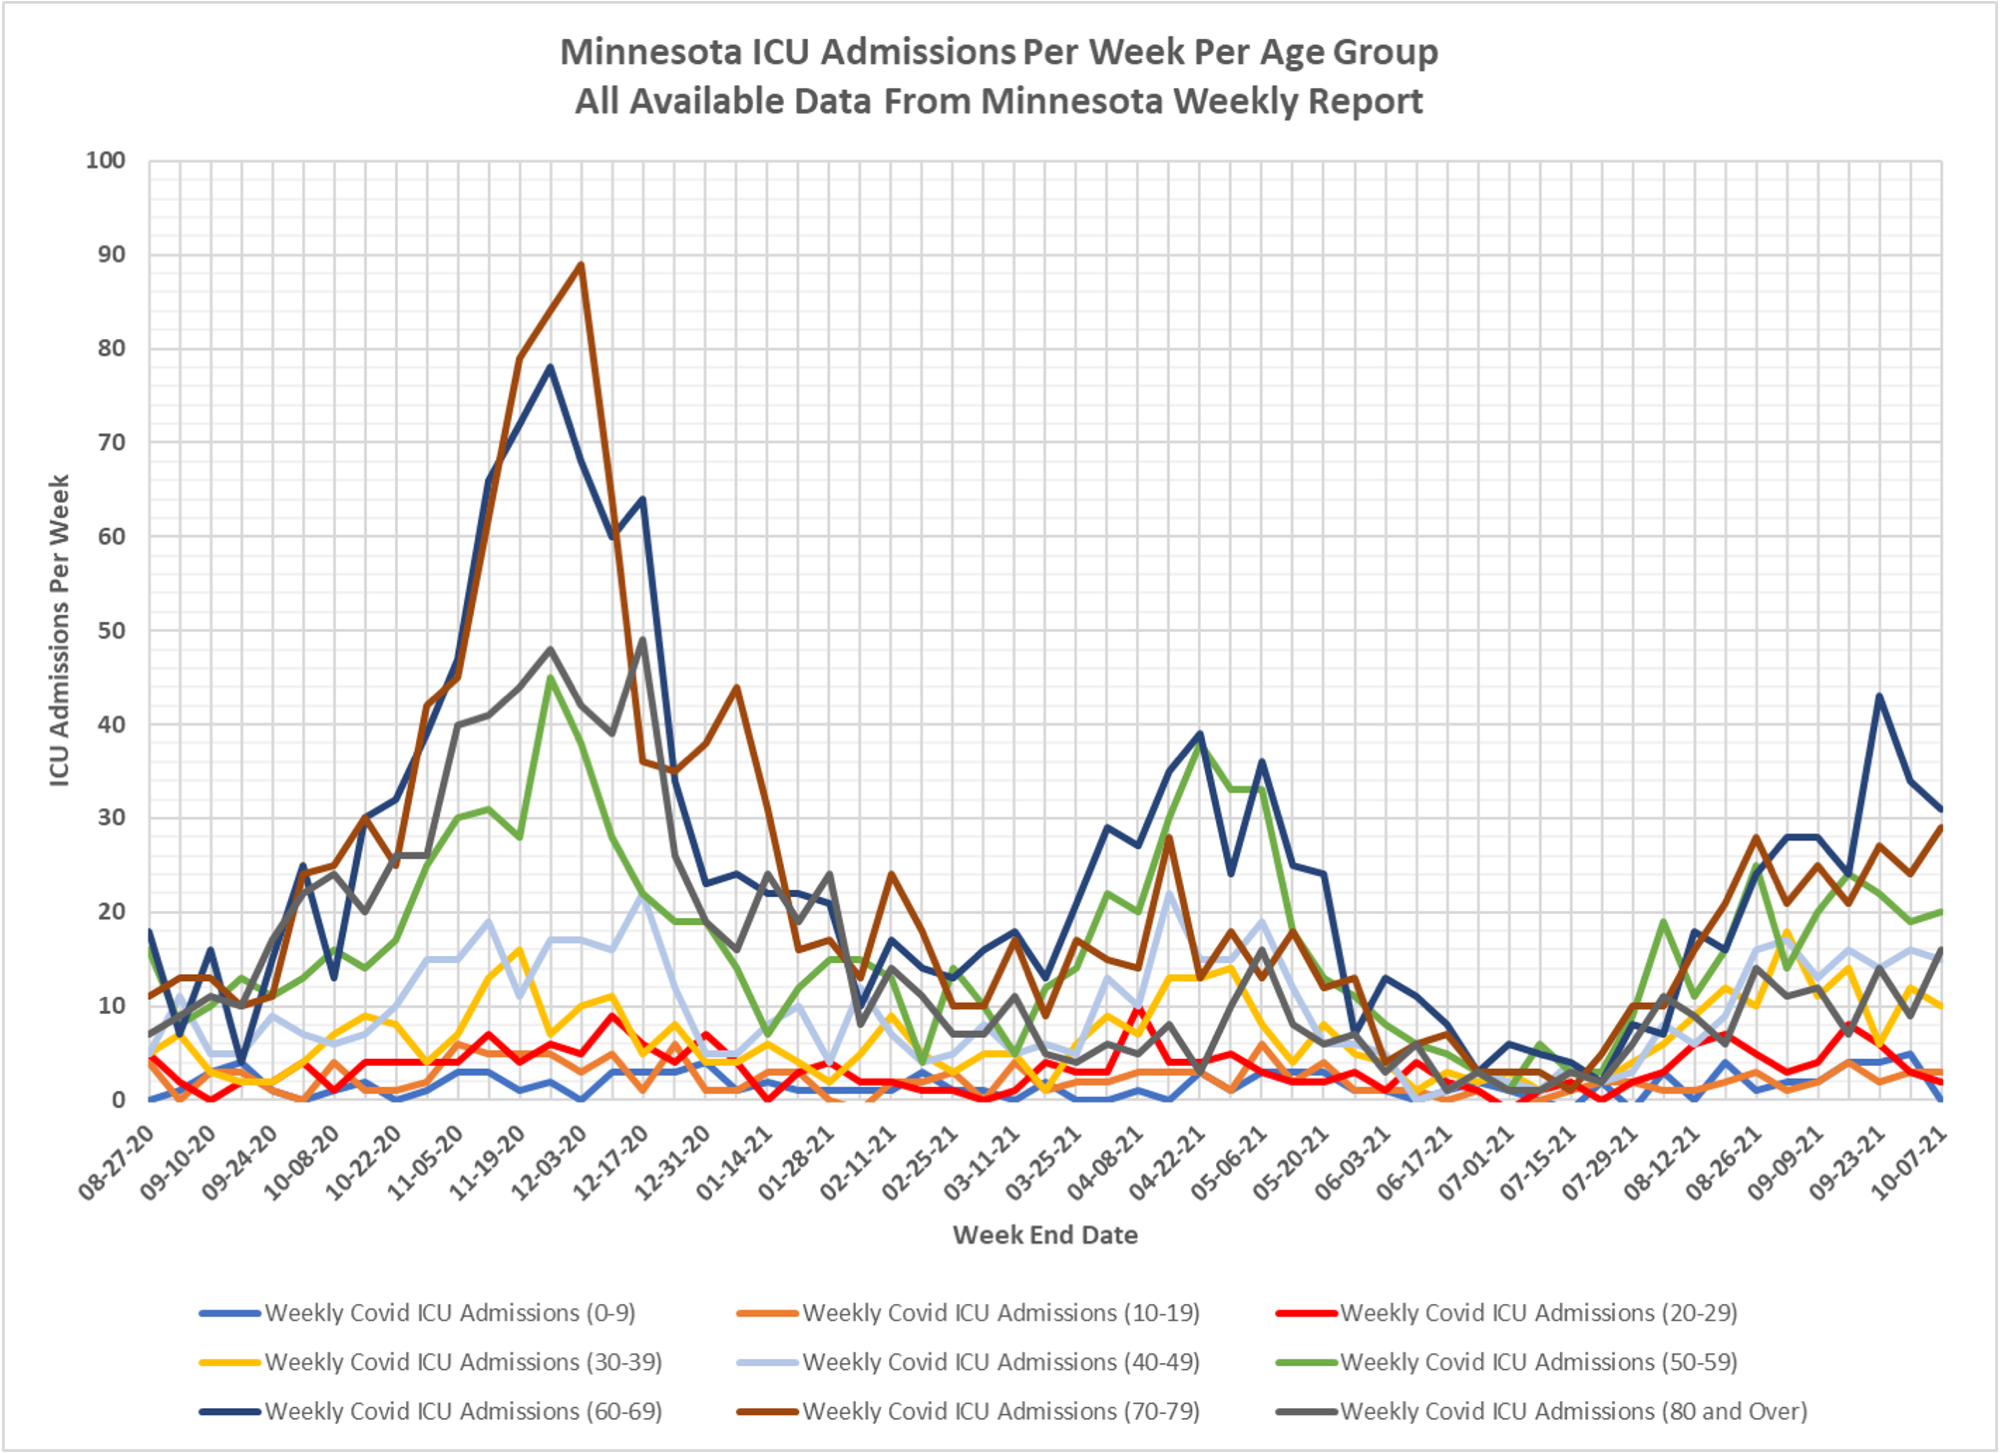
You can track differential trends in the epidemic in Minnesota by age group, Dave Dixon’s outstanding chart work again. Continuing high testing in the school-aged groups and high cases. Love to see those cycle numbers. Can’t be high, not much happening with hospitalizations there.