I mostly publish these to keep twitting DOH for the lies about children’s hospitalizations. And seeing relative trends among age groups can be helpful. Thanks again to Dave Dixon, whose notes are below.
1. As always, there are 2 slides for each set of data, one showing data for the whole pandemic and a second chart showing only data since early July, 2021.
2. The data for the charts on testing, hospital admissions, and deaths comes from the Minnesota Weekly Report (available here: https://www.health.state.mn.us/diseases/coronavirus/stats/index.html). The data in the Weekly Report is presented as cumulative totals for each data type each week. I am taking weekly differences and assembling the data into charts. This data is by date of report, meaning the charts are documenting new events reported this week, even though the underlying event occurred sometime in the past. The data is provided for 5 year age groups, and I am assembling into 10 year age groups to make the charts more readable.
3. The data for the Covid cases per week come from a data file published along with the Minnesota Weekly Report, here: https://www.health.state.mn.us/diseases/coronavirus/stats/index.html#wagscd1 This data is published by date of specimen collection, rather than by date of report as the other data is. The data is provided as cases per week in 5 year age groups. I am compiling the data into 10 year age groups in order for the charts to be more readable.
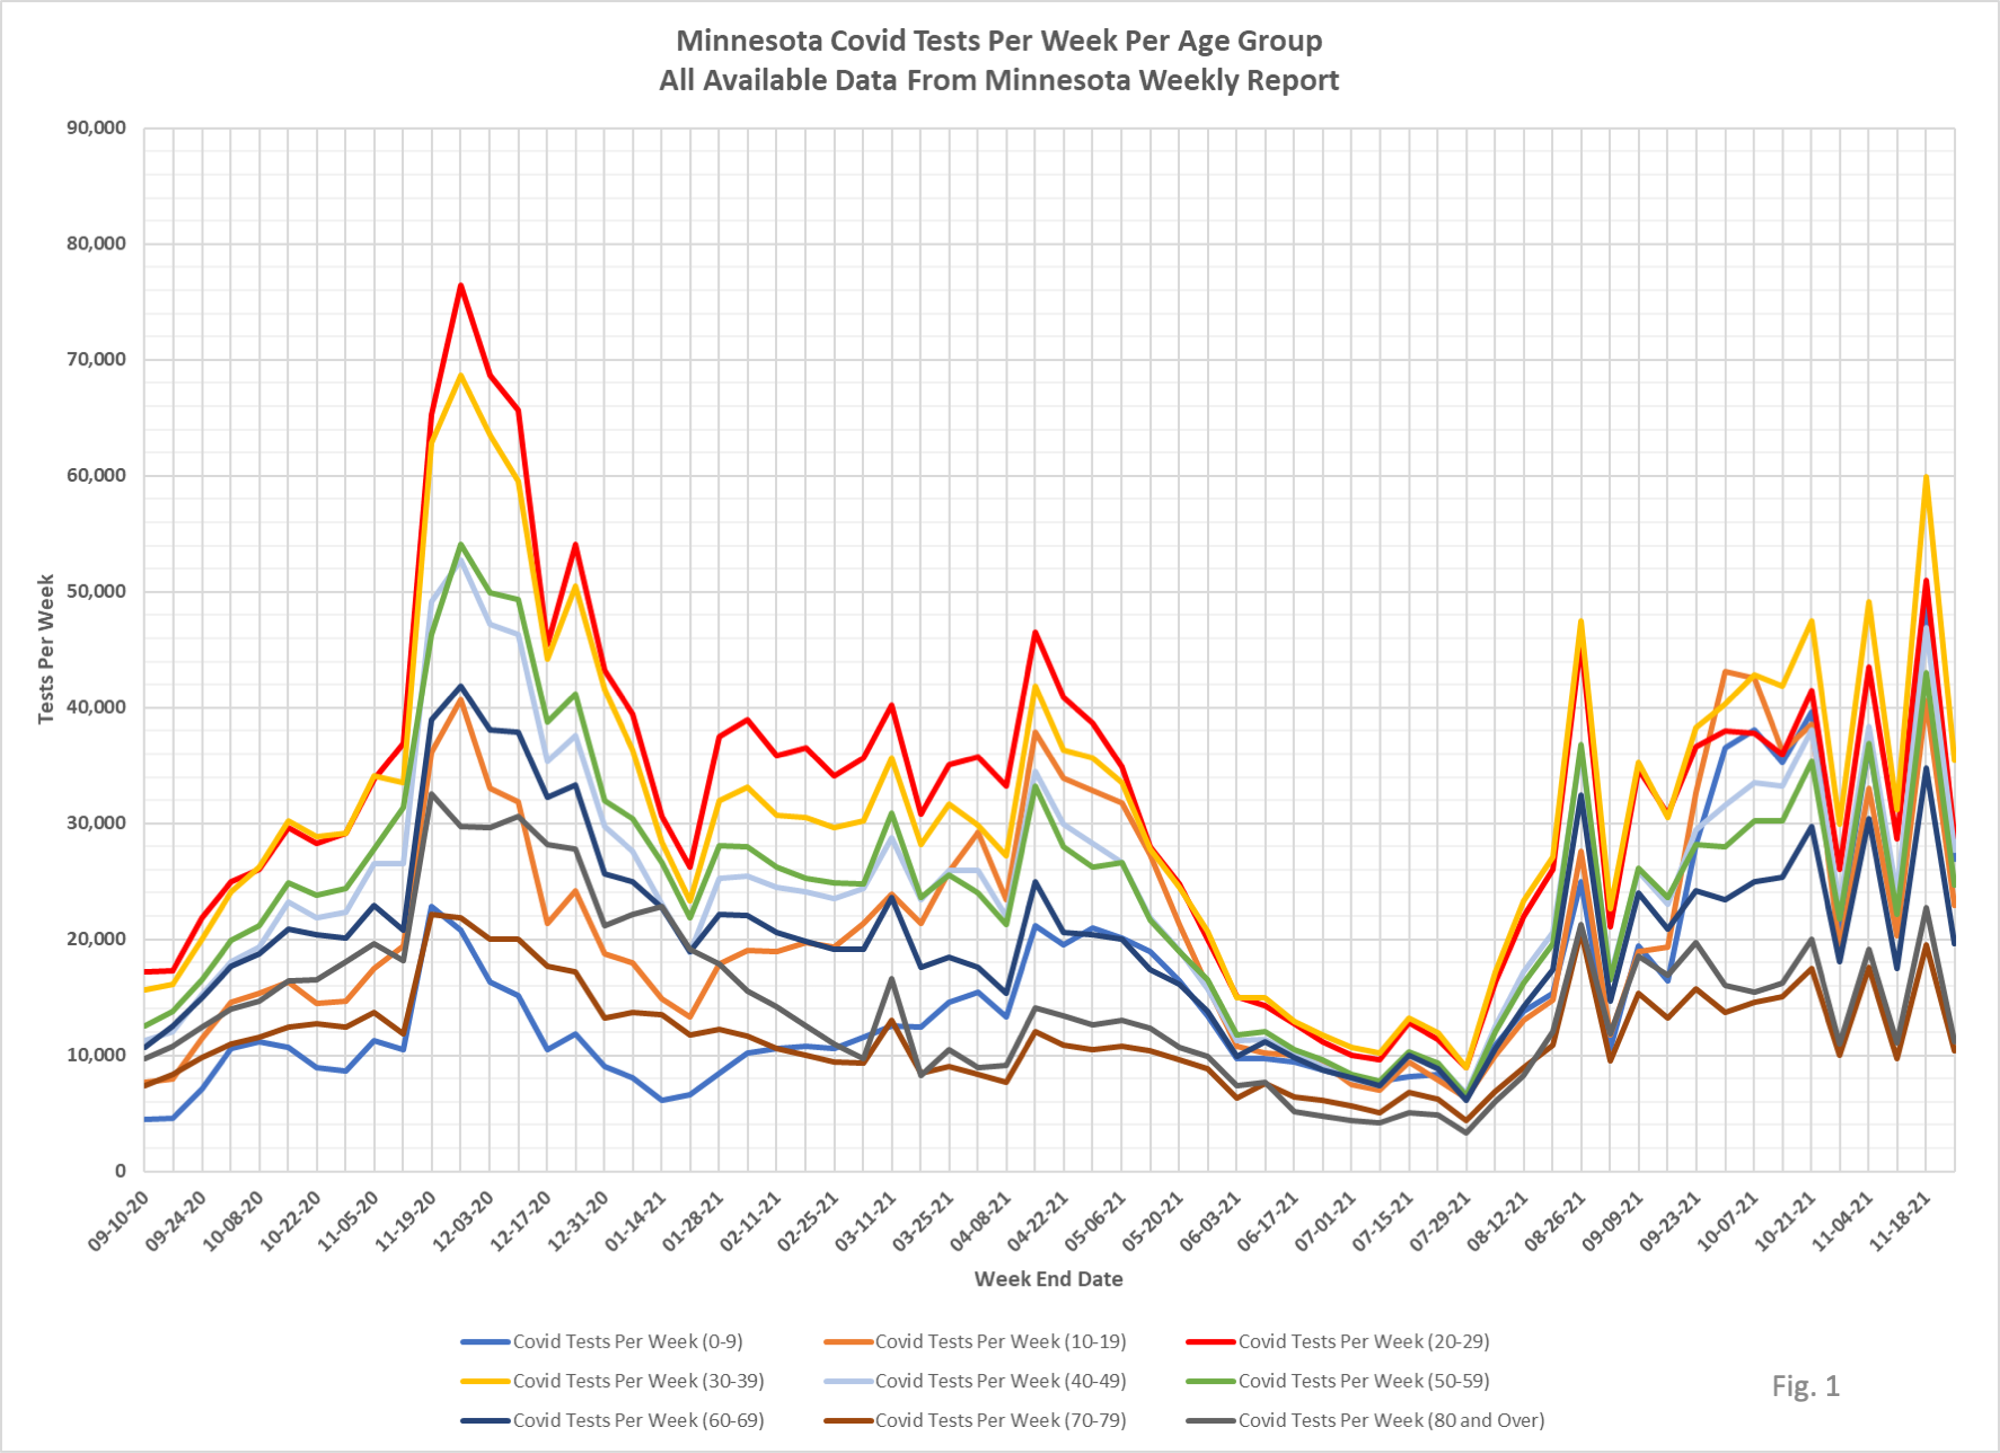
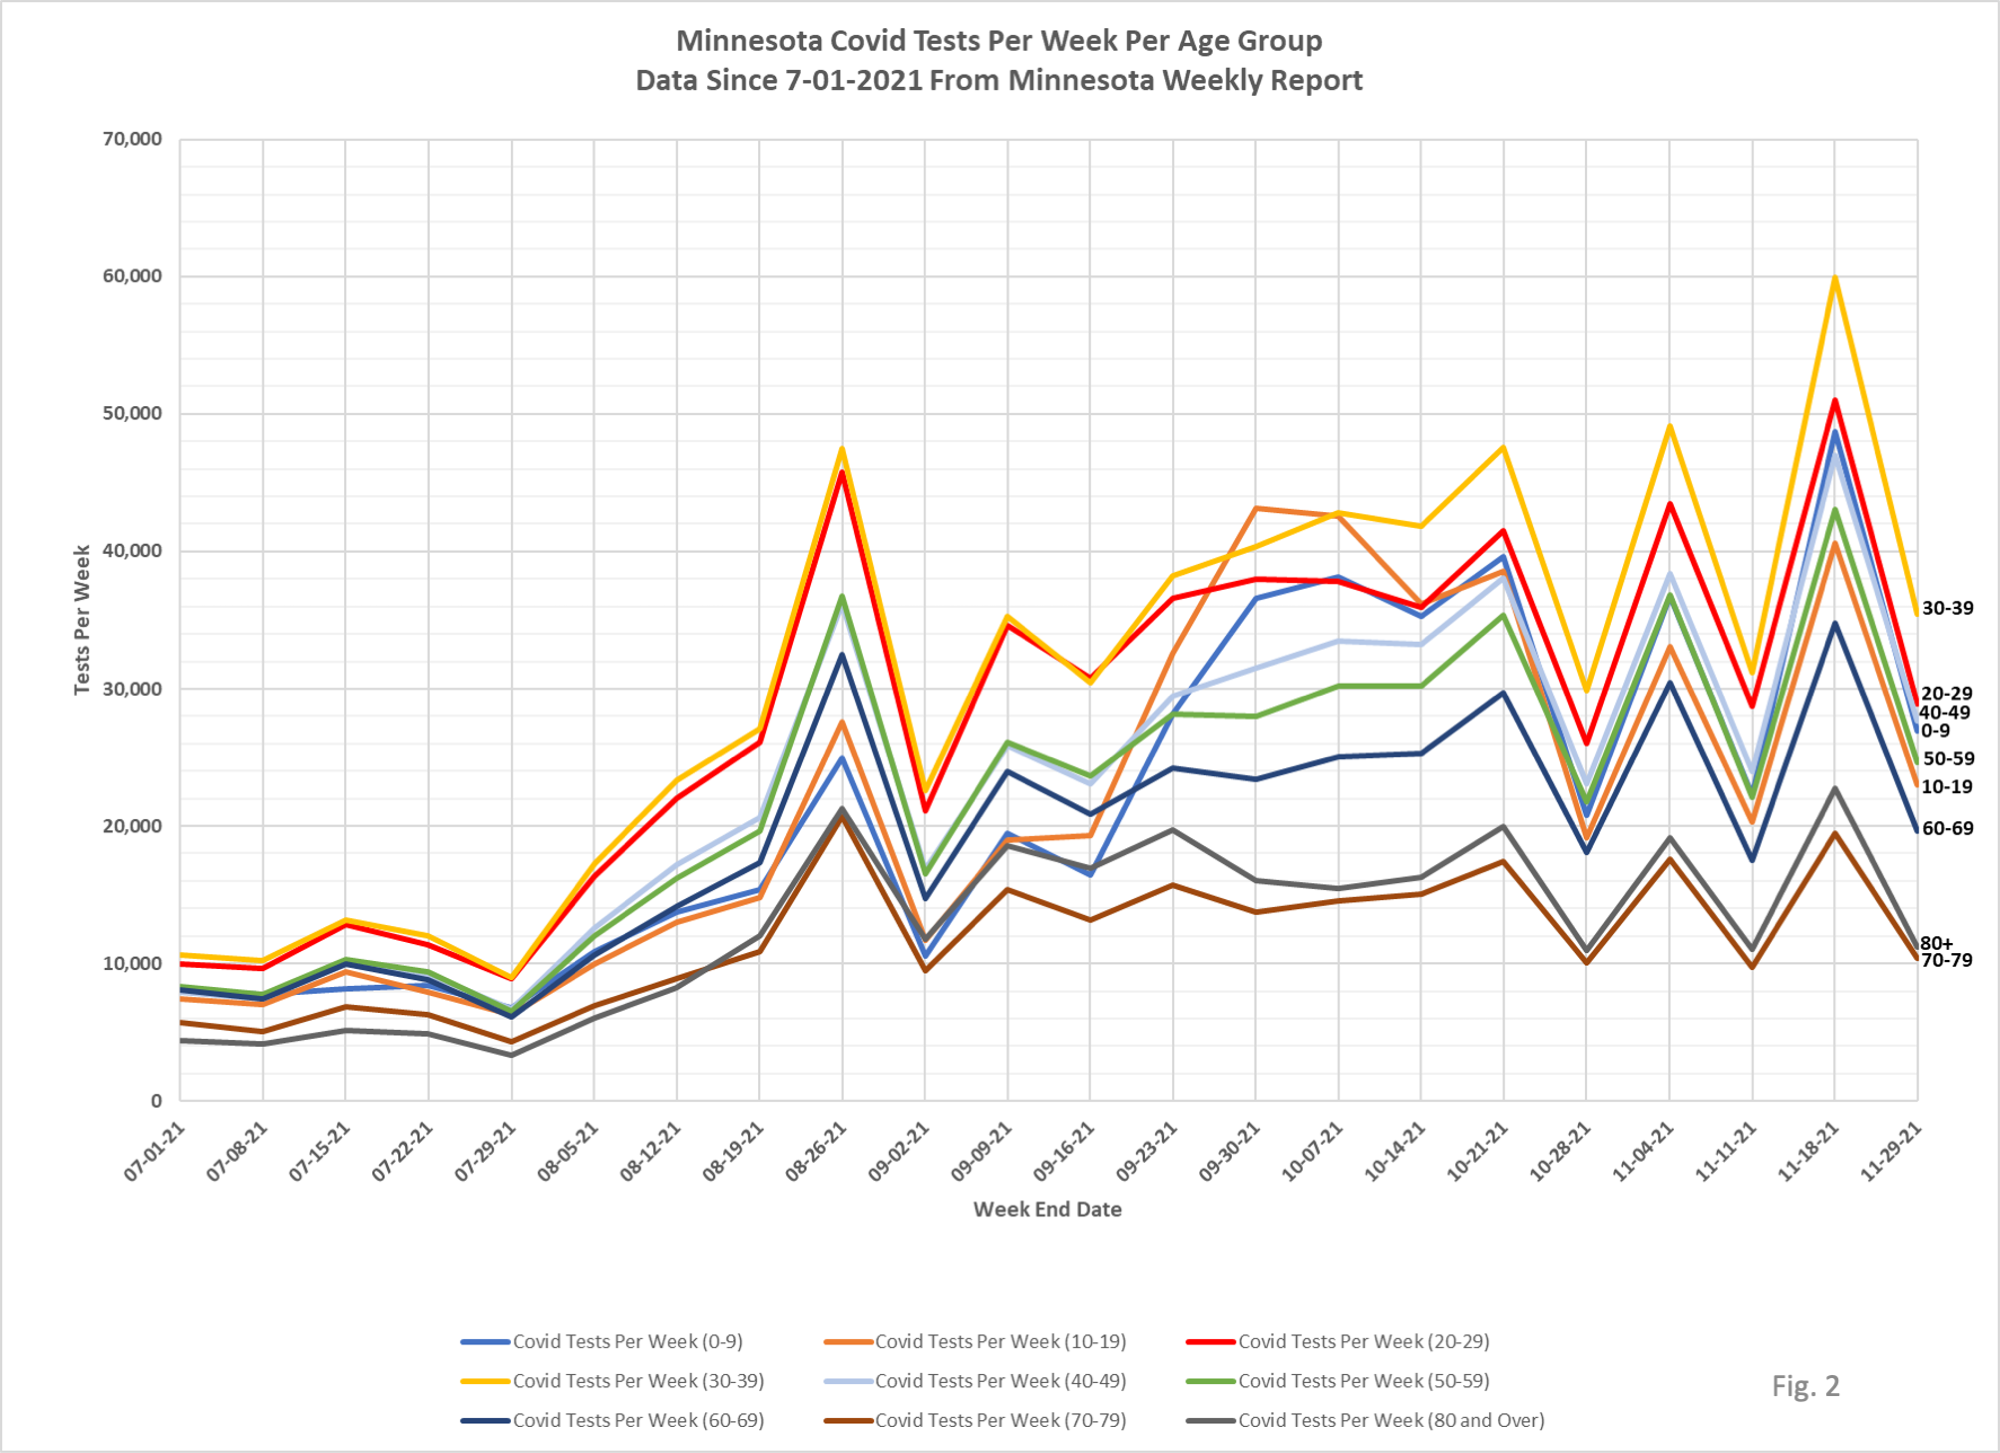
4. Fig. 1 and 2: Covid Tests Per Week. The major changes up and down in weekly testing rates continues for the fifth week in a row. The Minnesota Situation Update page (https://www.health.state.mn.us/diseases/coronavirus/situation.html) reports testing by date of test (although without the age breakdowns). The testing reported in the Situation Update does not exhibit the large up and down swings that the Weekly Report does.
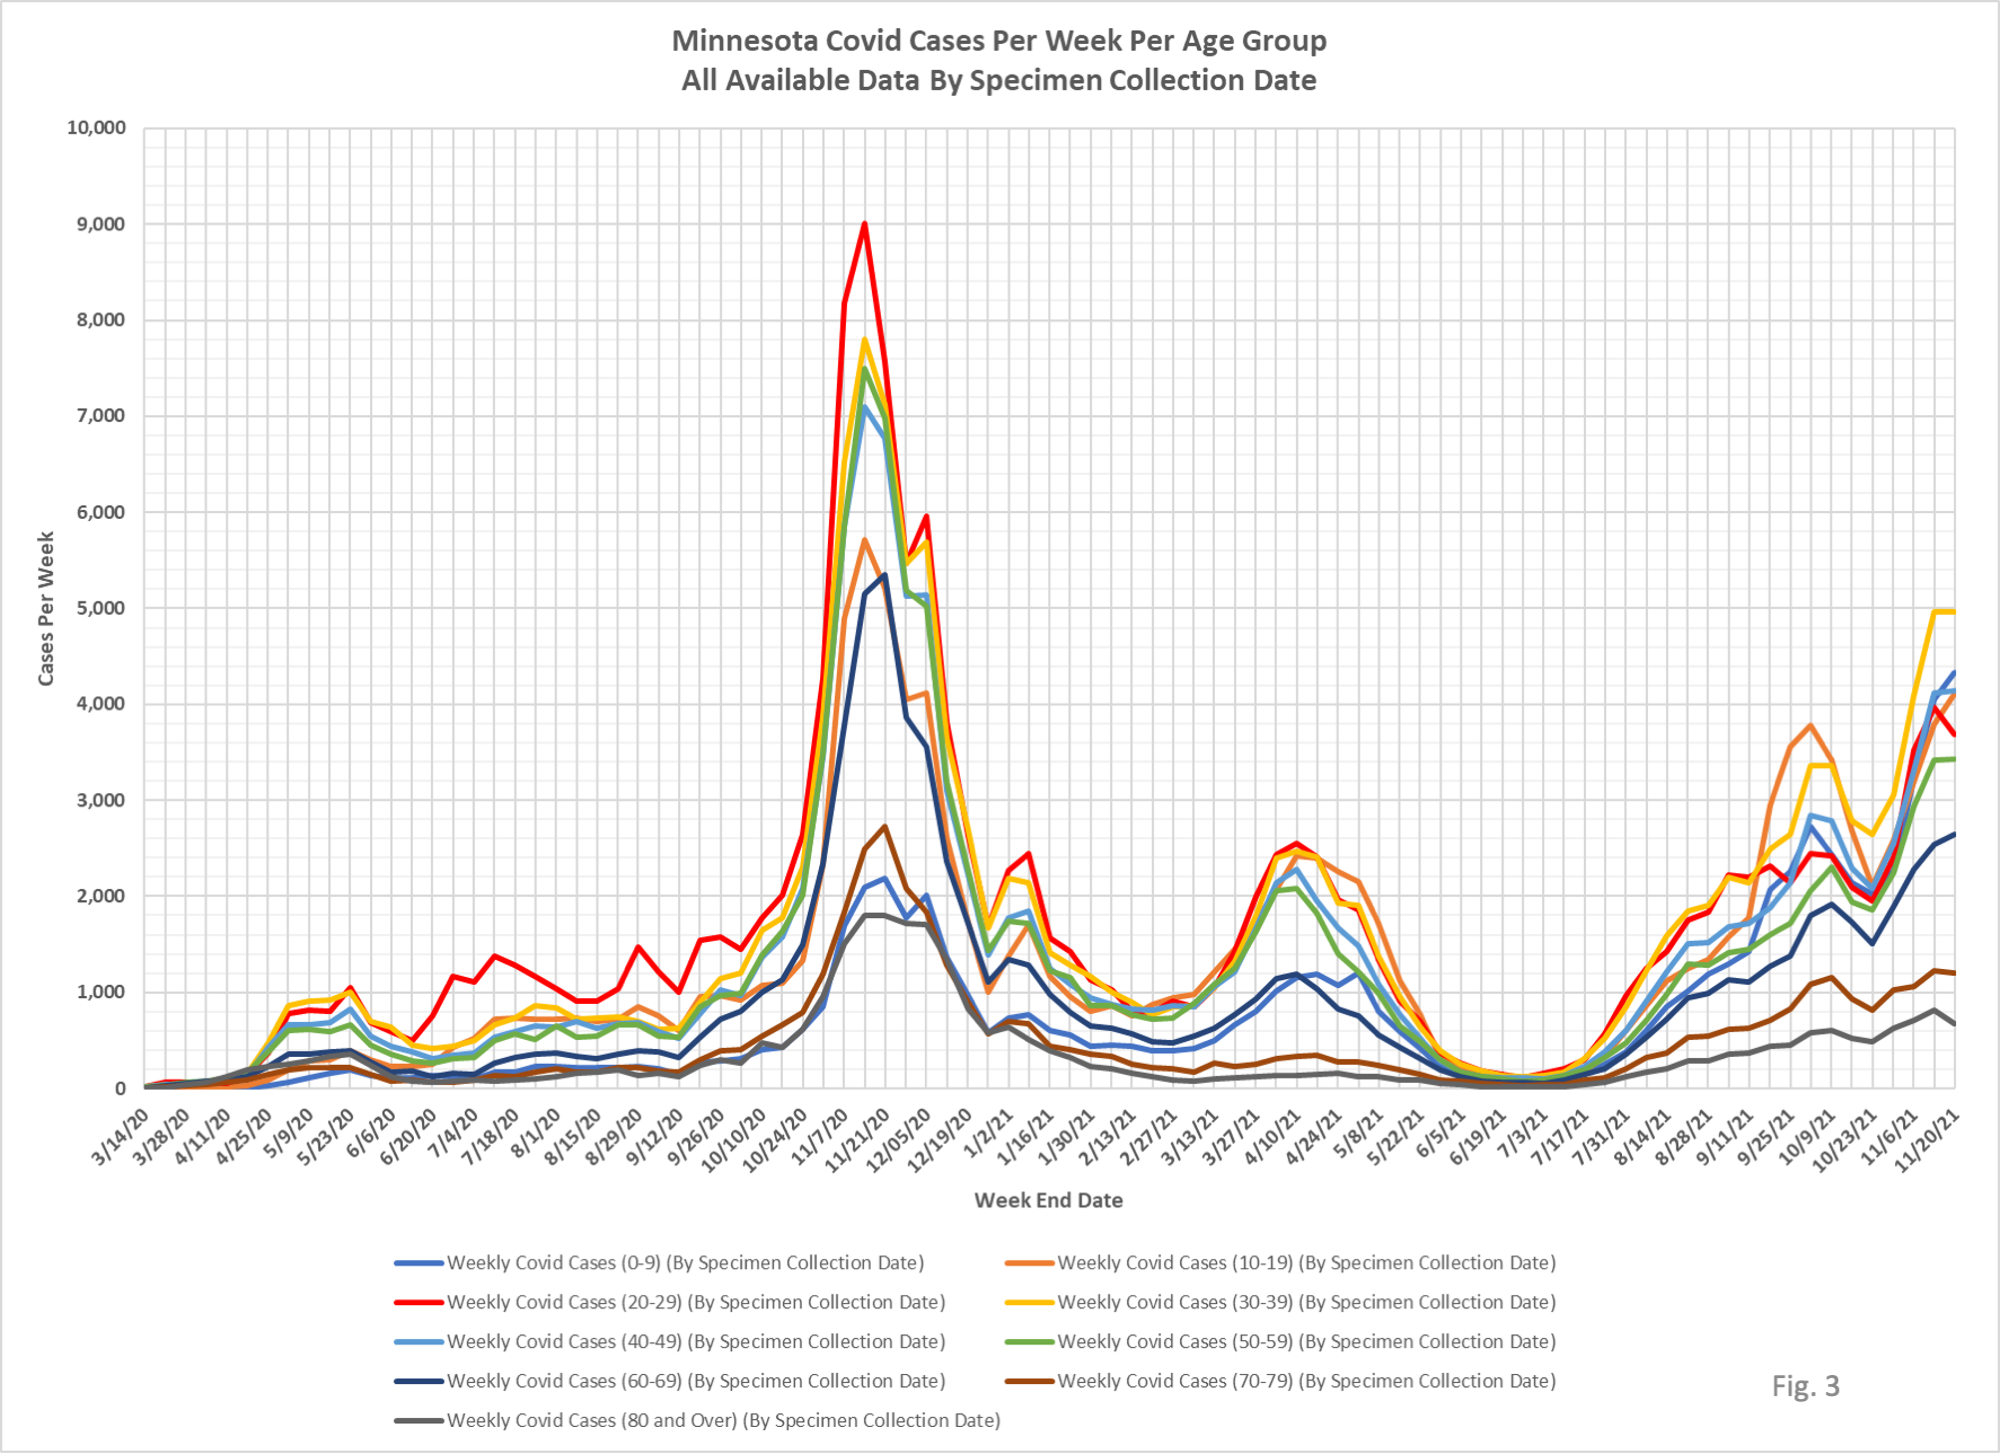
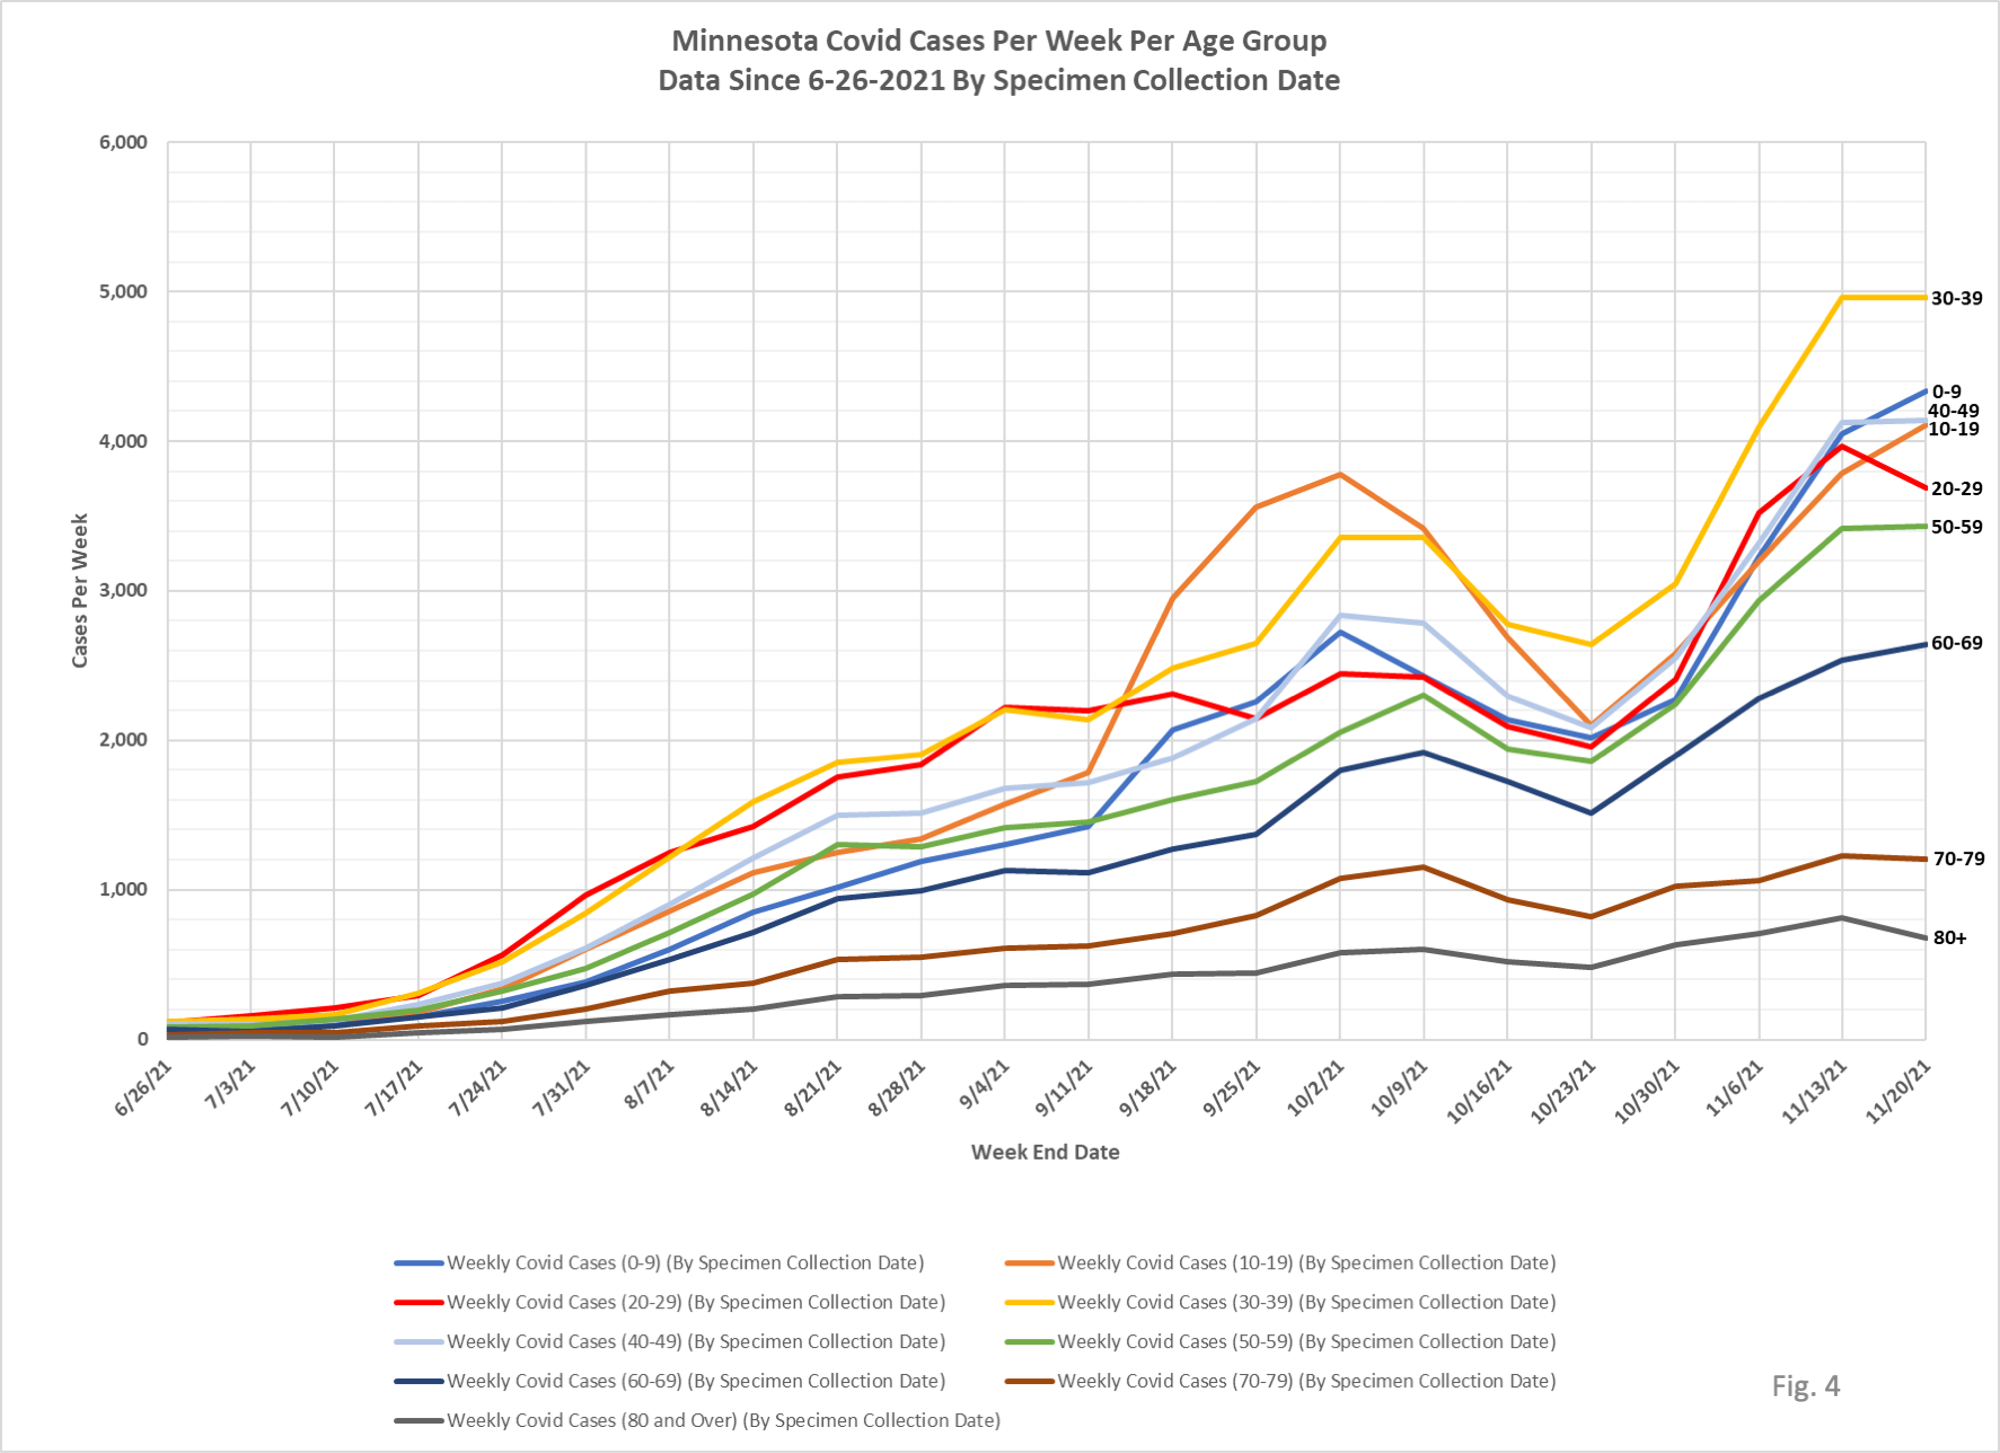
5. Fig. 3 and 4: Covid Cases Per Week. The Covid cases per week were generally flat this week for all age groups, except for the 0-9 and 10-19 age groups which rose, and the 20-29 age group which dropped. Since the Covid tests per week data is unreliable we do not know if the higher number of cases in the 0-9 and 10-19 age groups are due to increased testing levels, or increased positivity rates. Total cases for the week were reported as 29,175, an overall decrease of 0.34% over last week’s total.
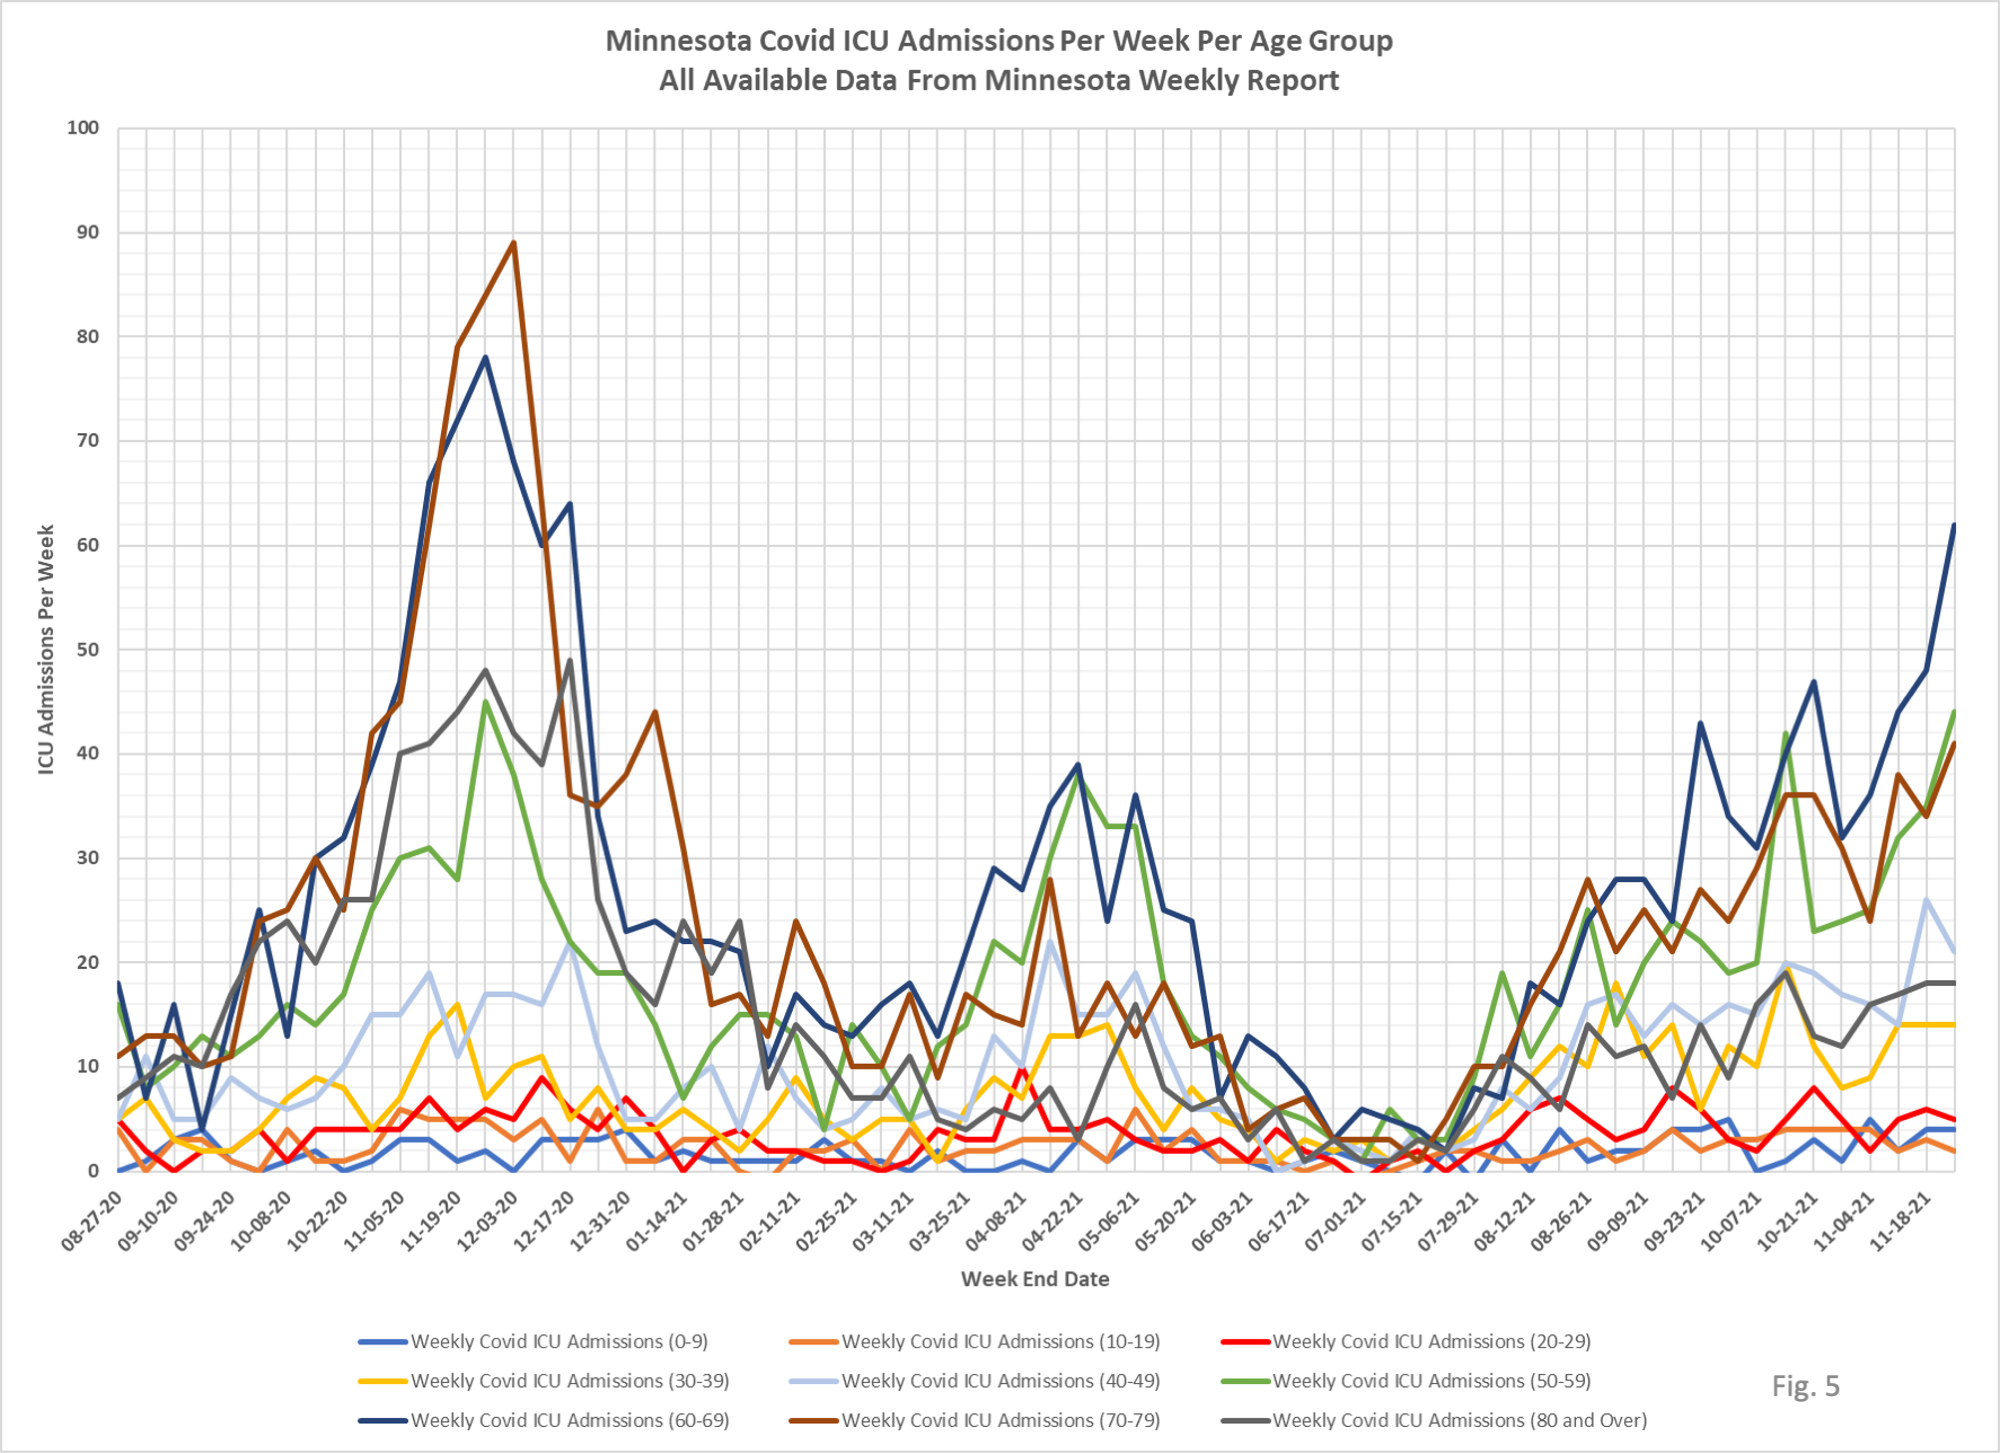
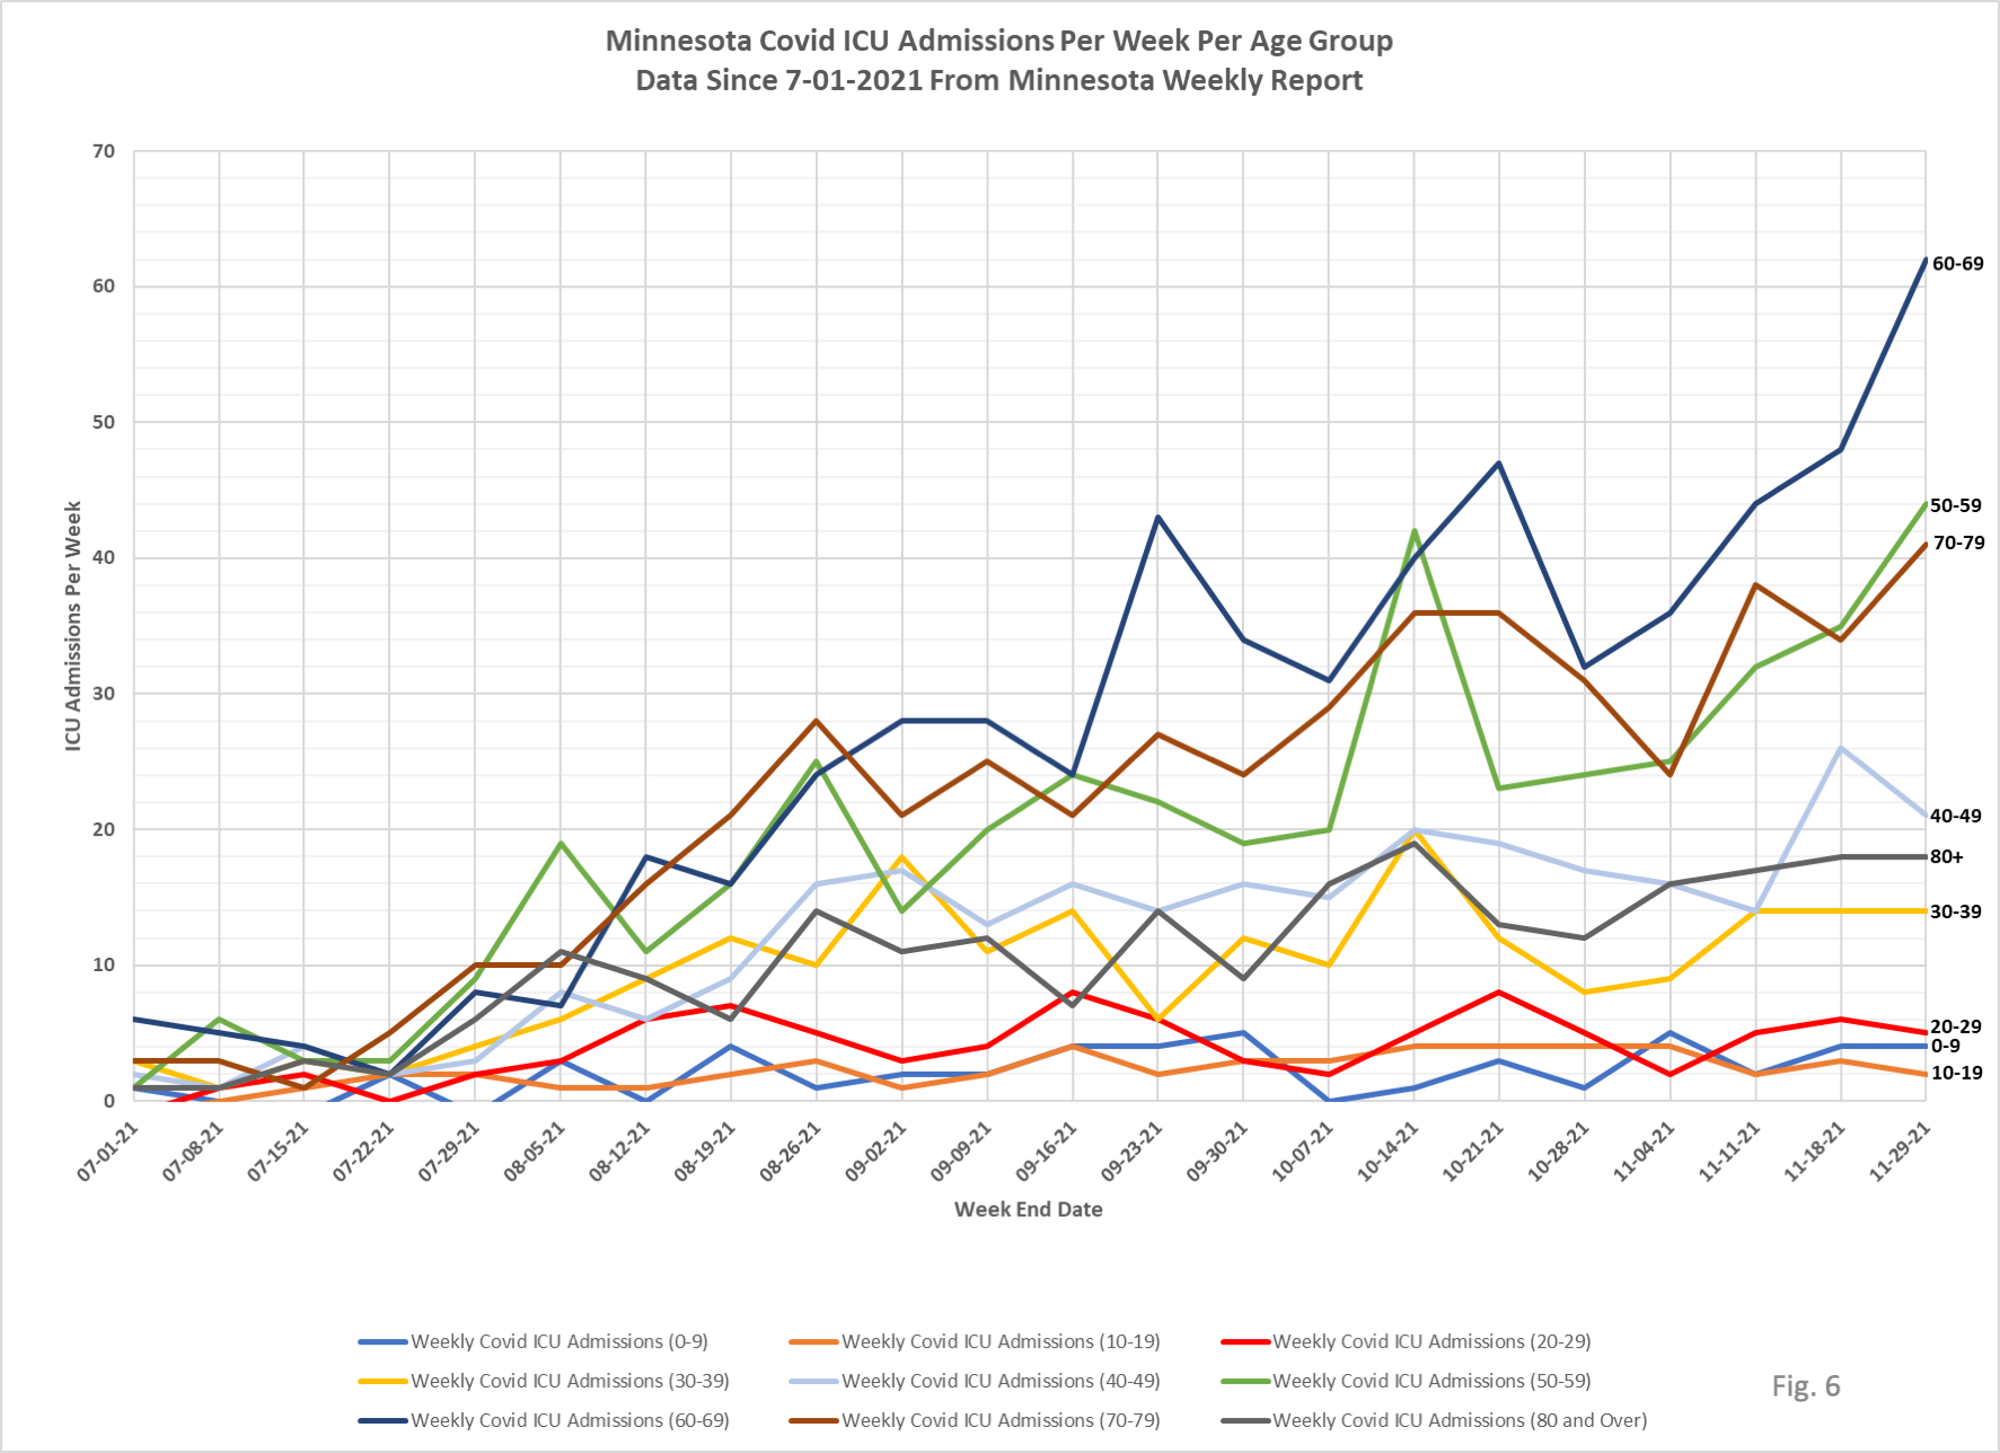
6. Fig. 5 and 6: ICU Admissions Per Week. There were 4 reported Covid ICU admissions in the 0-9 age group in this Weekly Report, and 2 in the 10-19 age group. There still appears to be very minor impact of Covid infections on ICU admissions for school age children, with little change in the rate of childhood ICU admissions over many months. Total ICU admissions for the week were 211, which is 23 more than the prior week. There were large increases in admissions for the 50-59, 60-69, and 70-79 age groups. The highest reported Covid ICU admissions during the entire pandemic were 292 the week ending 11/26/2020, at last winter’s peak.
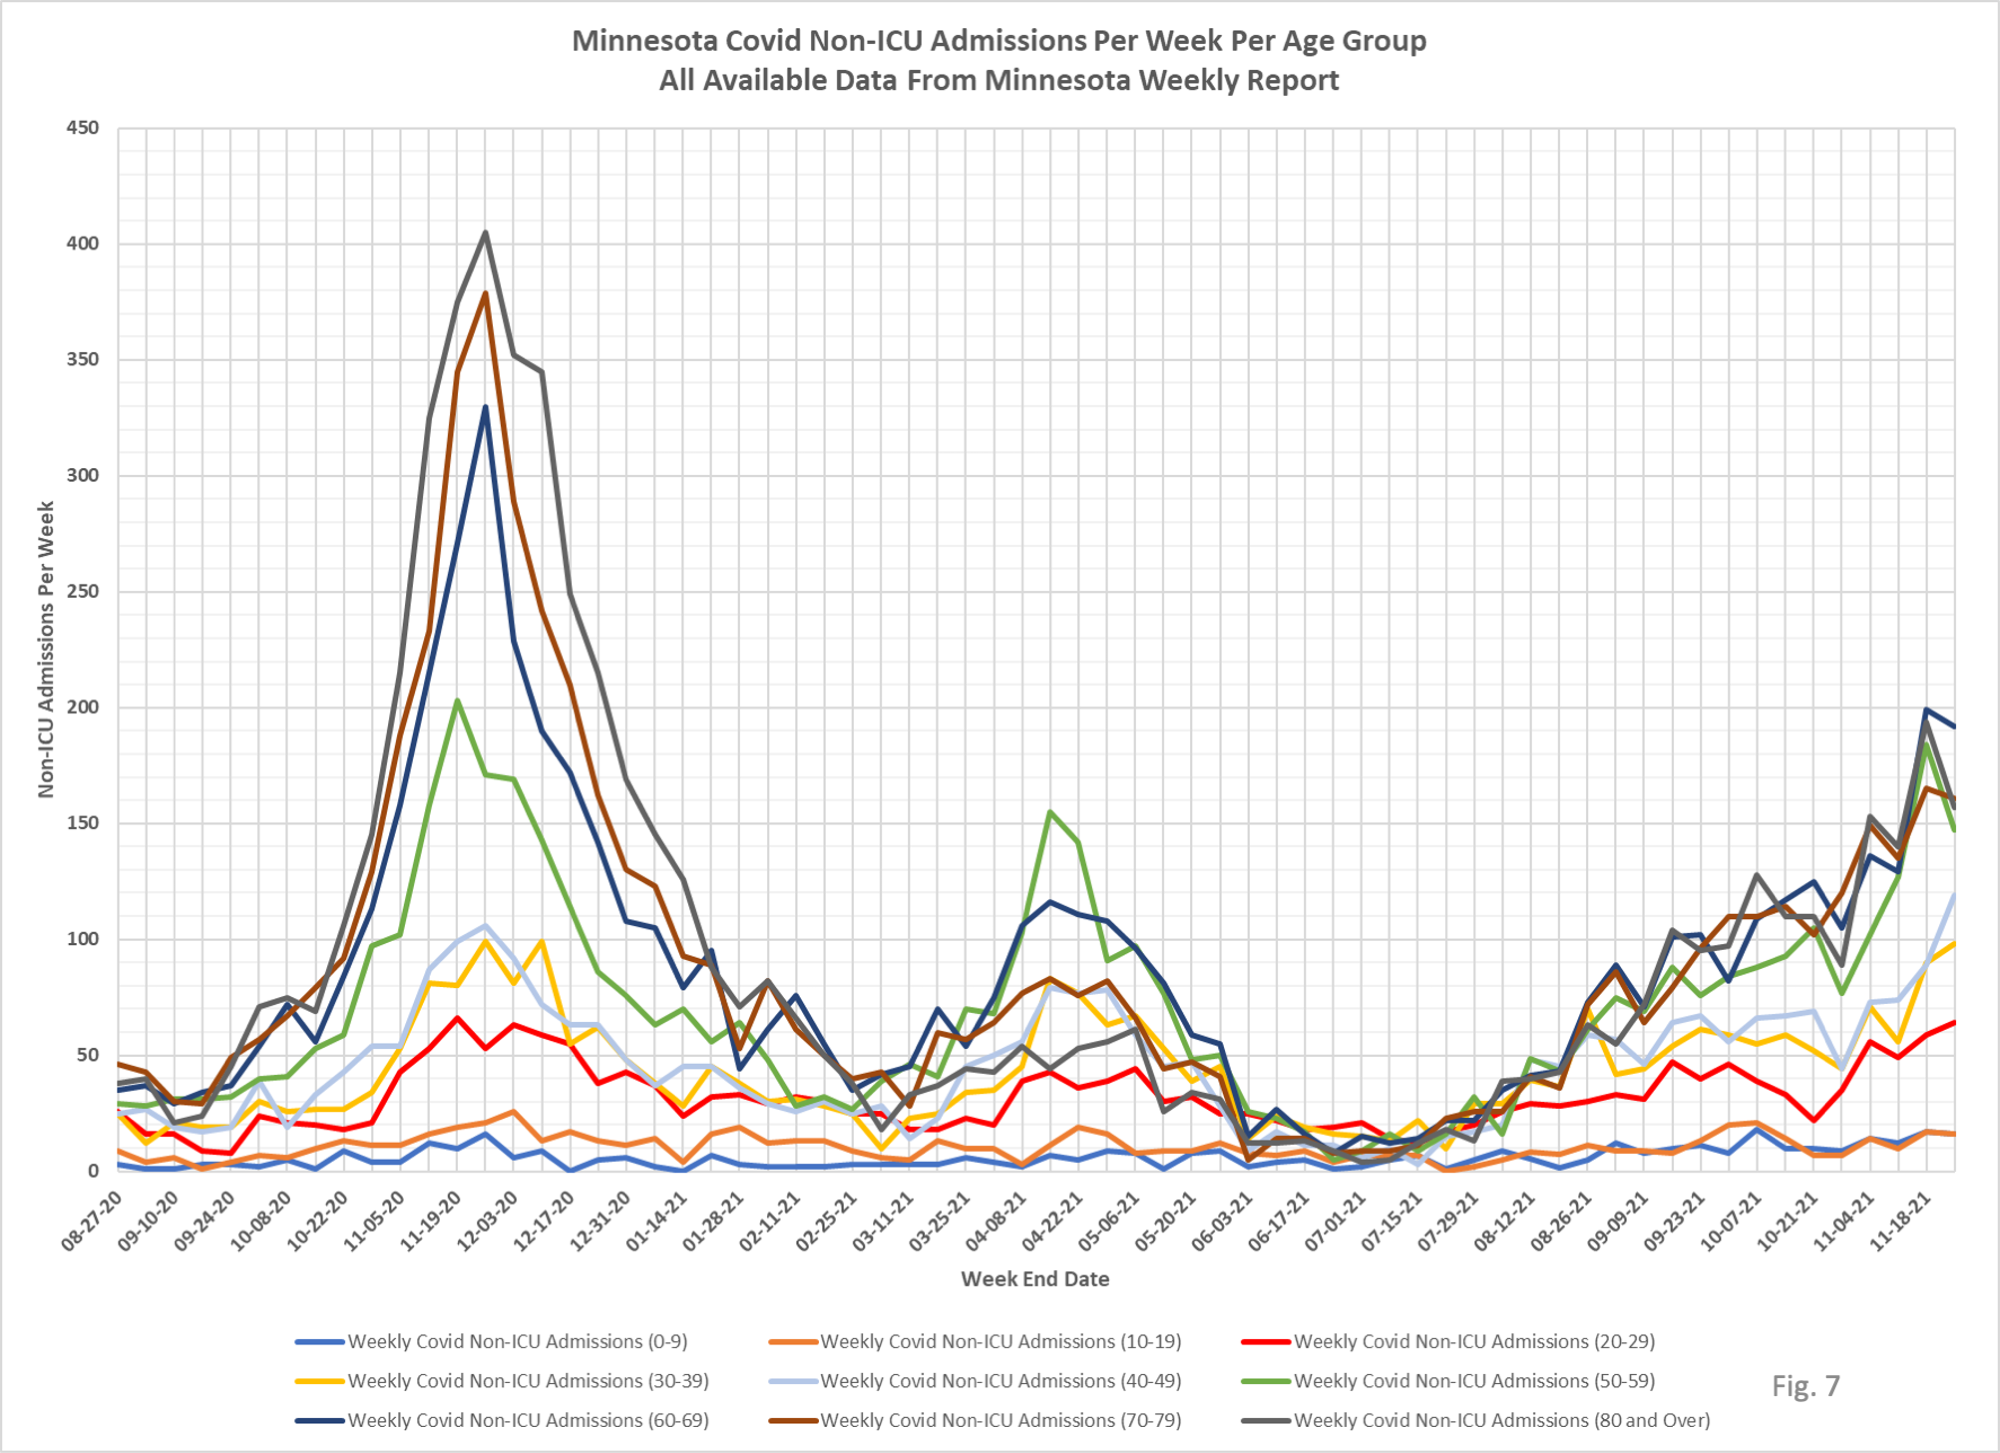
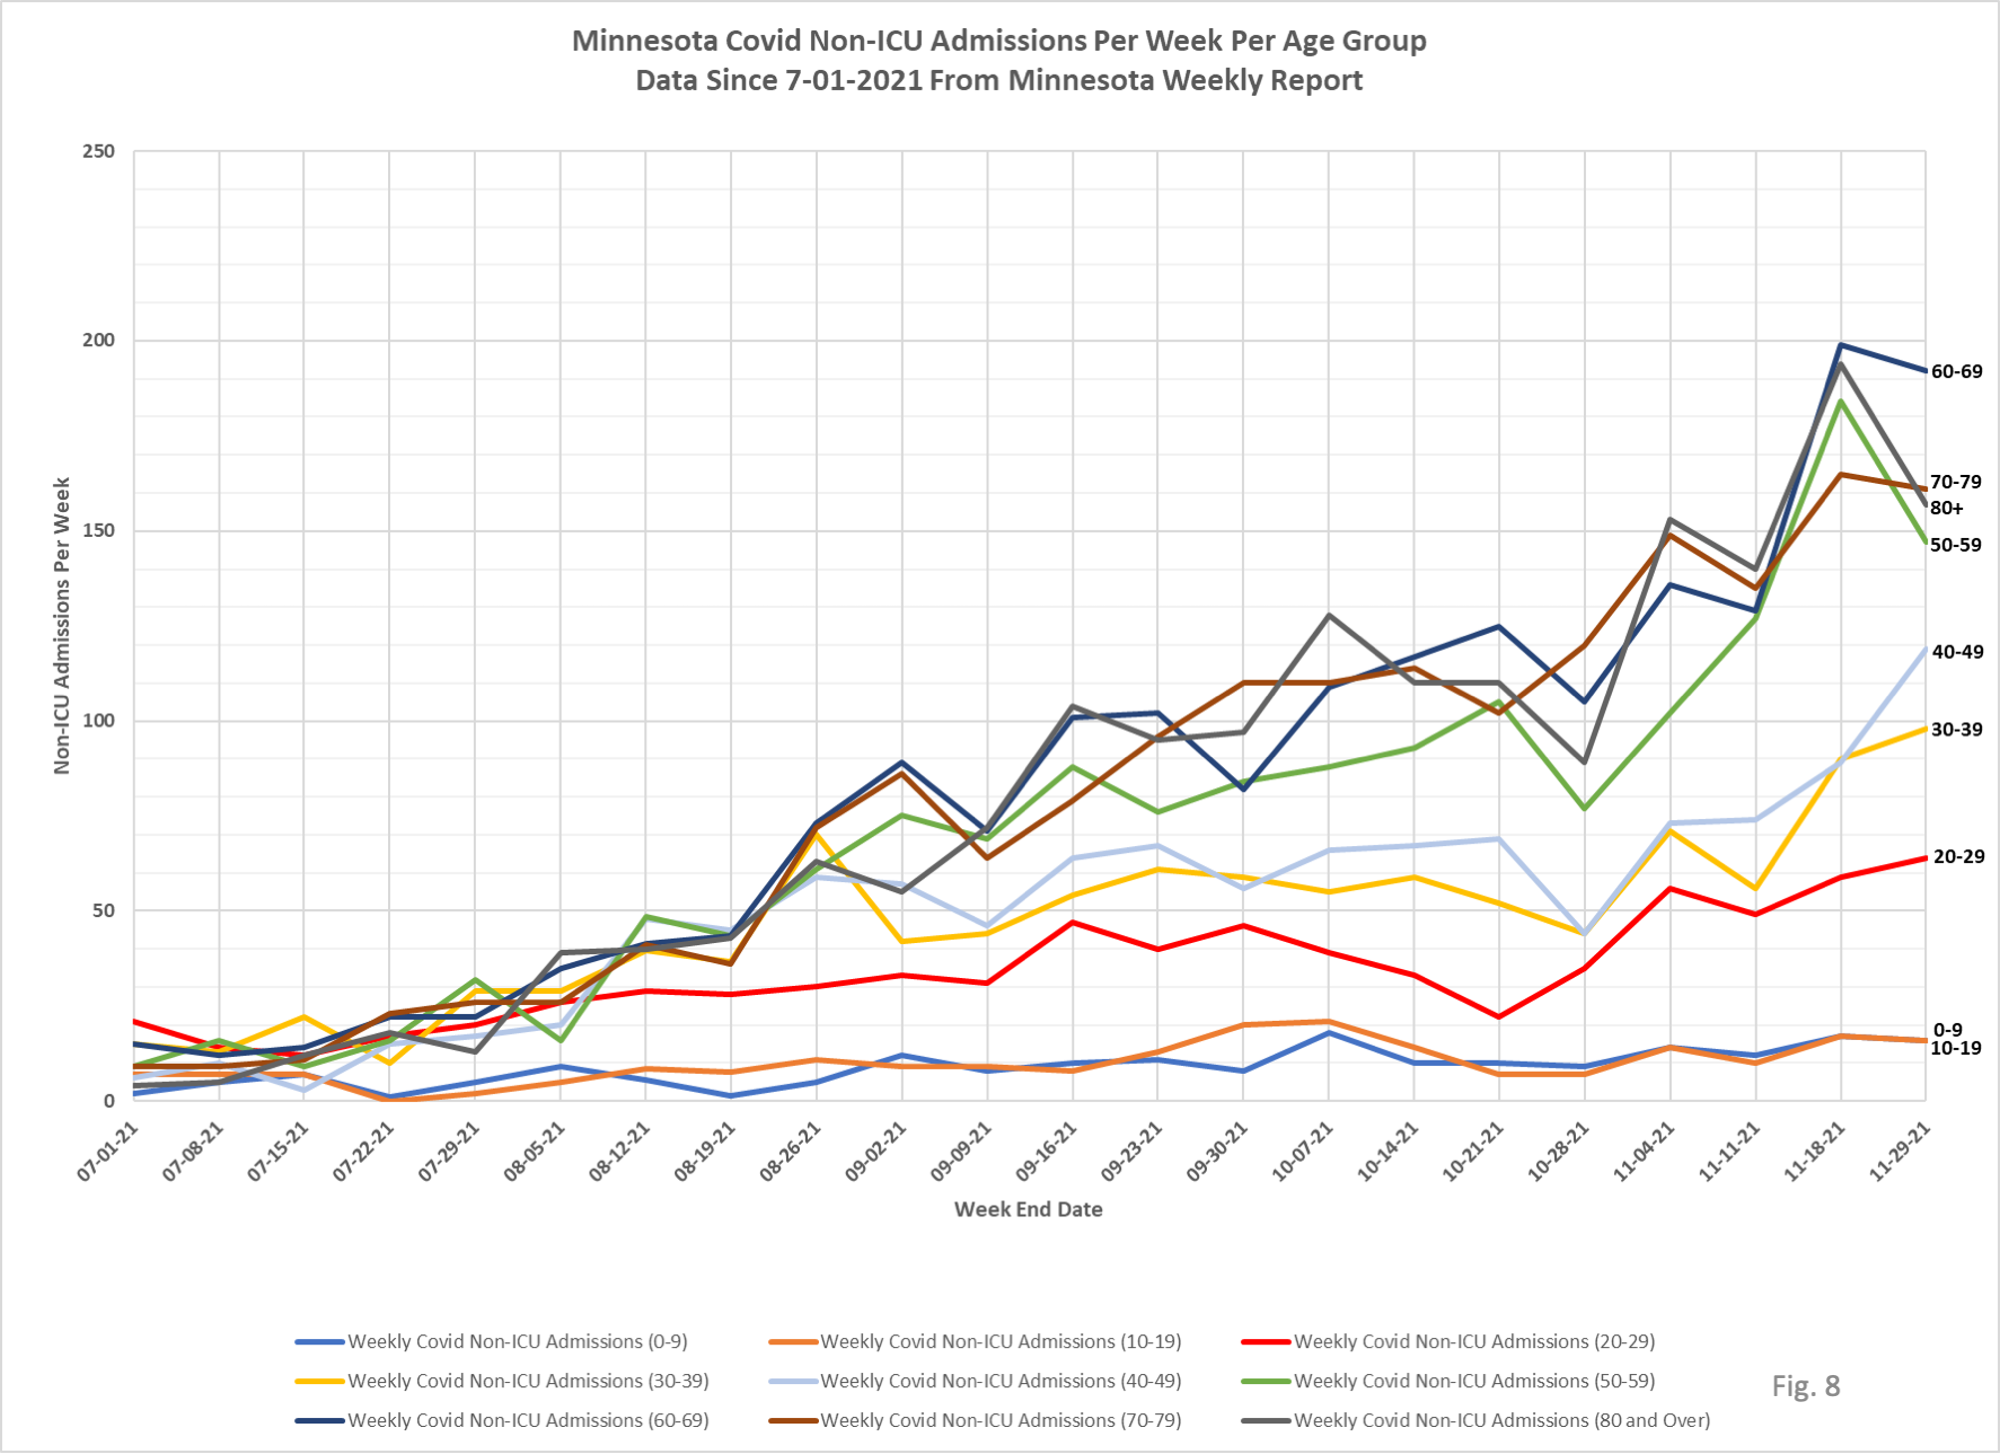
7. Fig. 7 and 8: Non-ICU Admissions Per Week. Non-ICU admissions were generally lower in the older (50+) age groups this week, higher in the 20-49 age groups, and flat for the 0-9 and 10-19 age groups. Non-ICU Covid admissions for the younger age groups remain very low, as they have for many months. The 0-9 and 10-19 age groups each had 16 Non-ICU Covid admissions for the week, down from 17 admissions for each group last week. Total Non-ICU Covid admissions for the week were 970, a reduction of 44 admissions from the 1014 admissions last week.
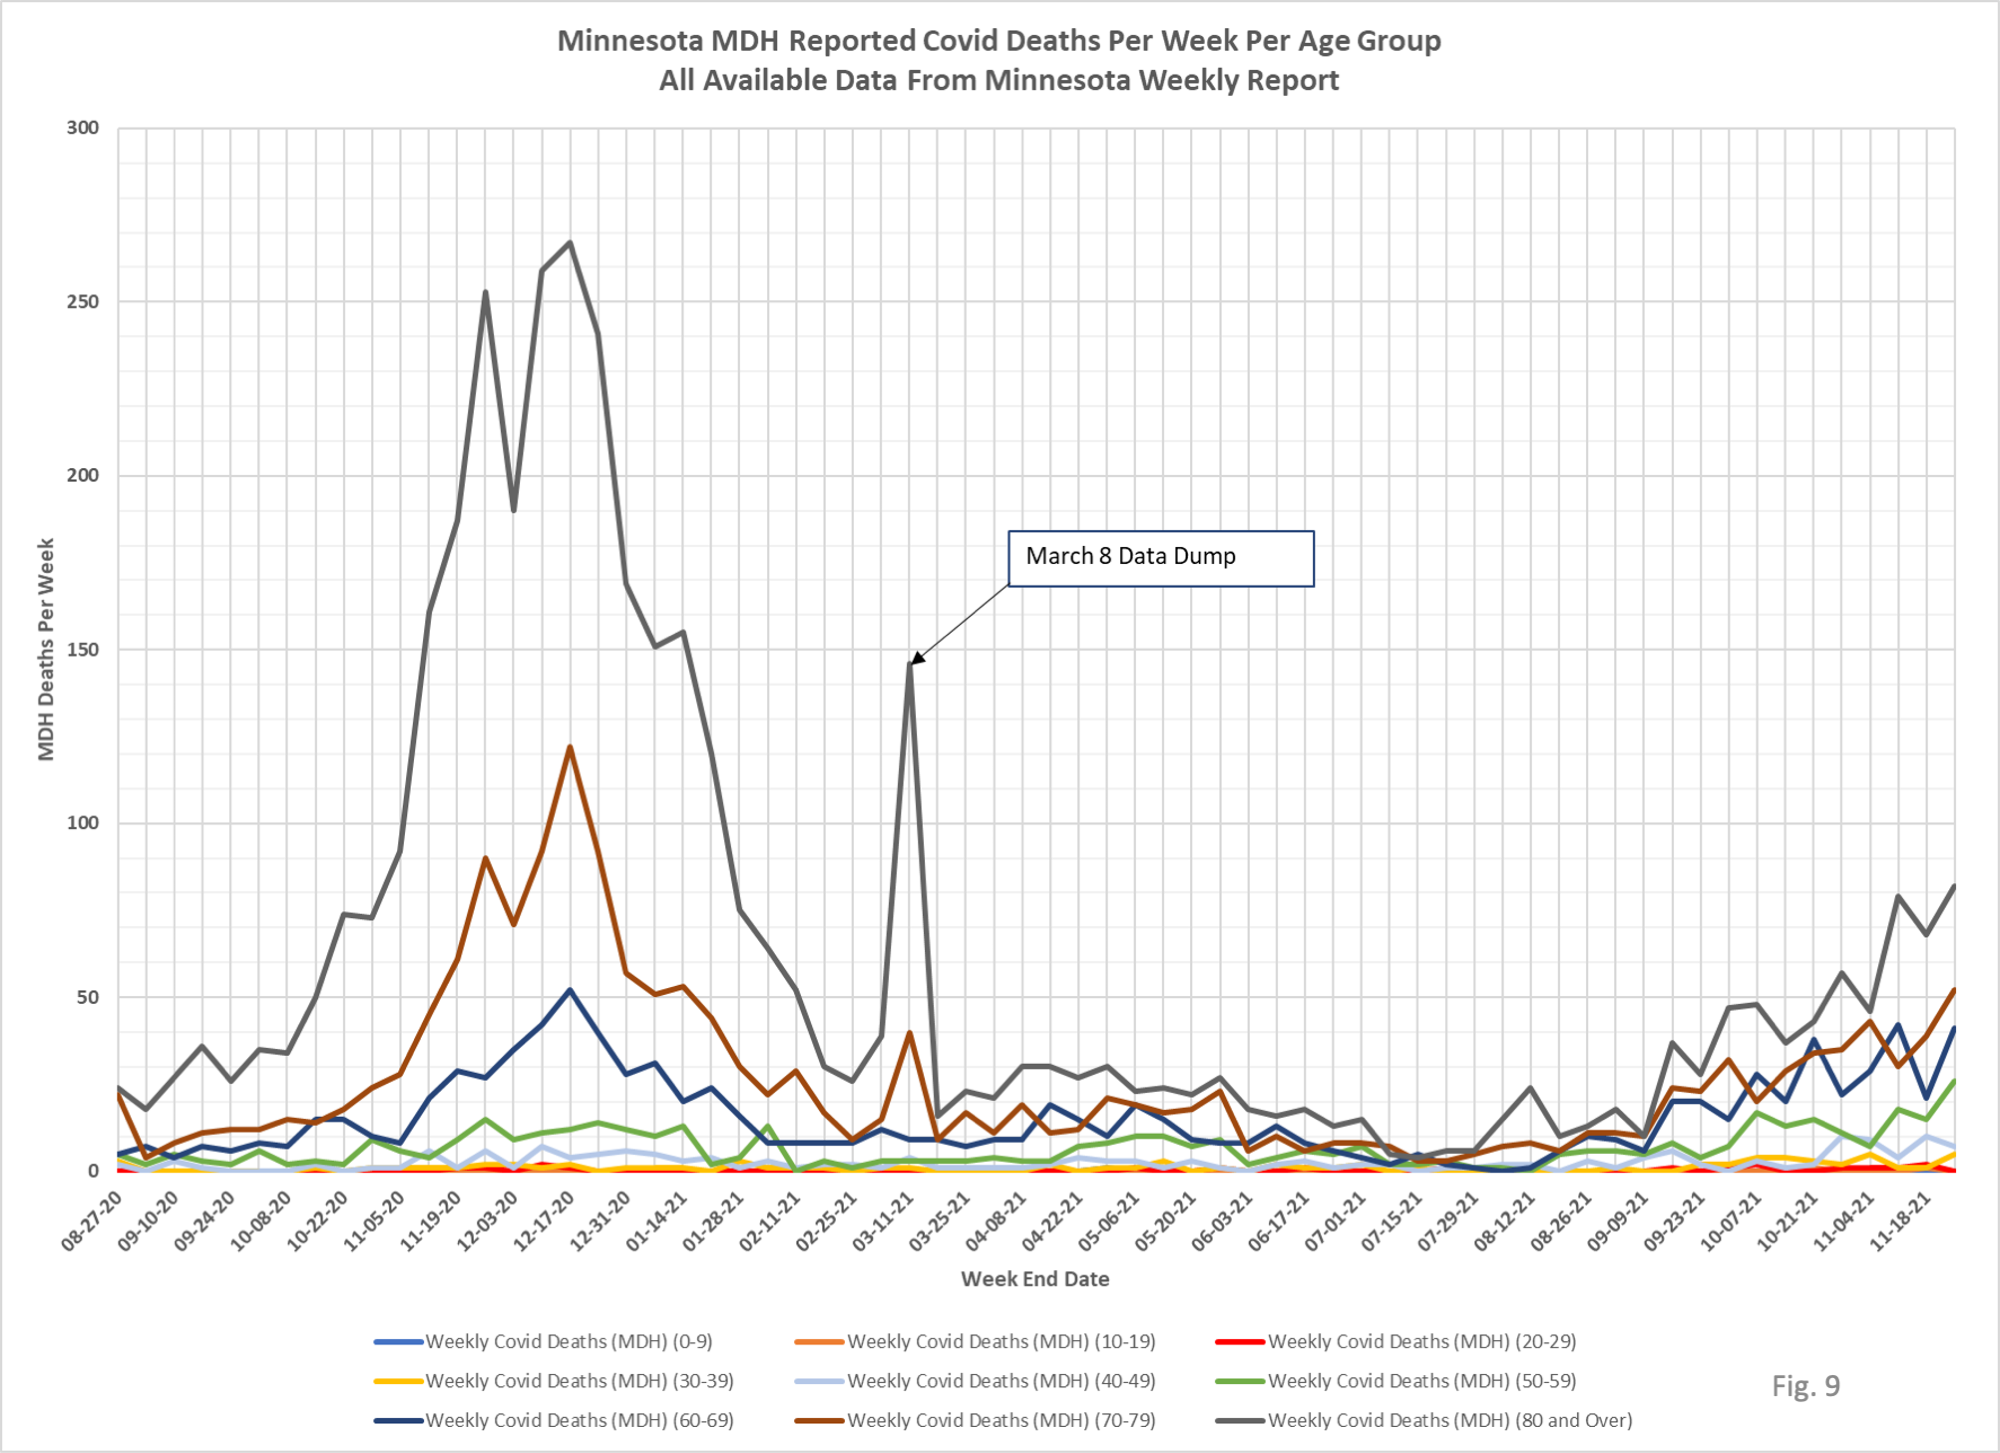
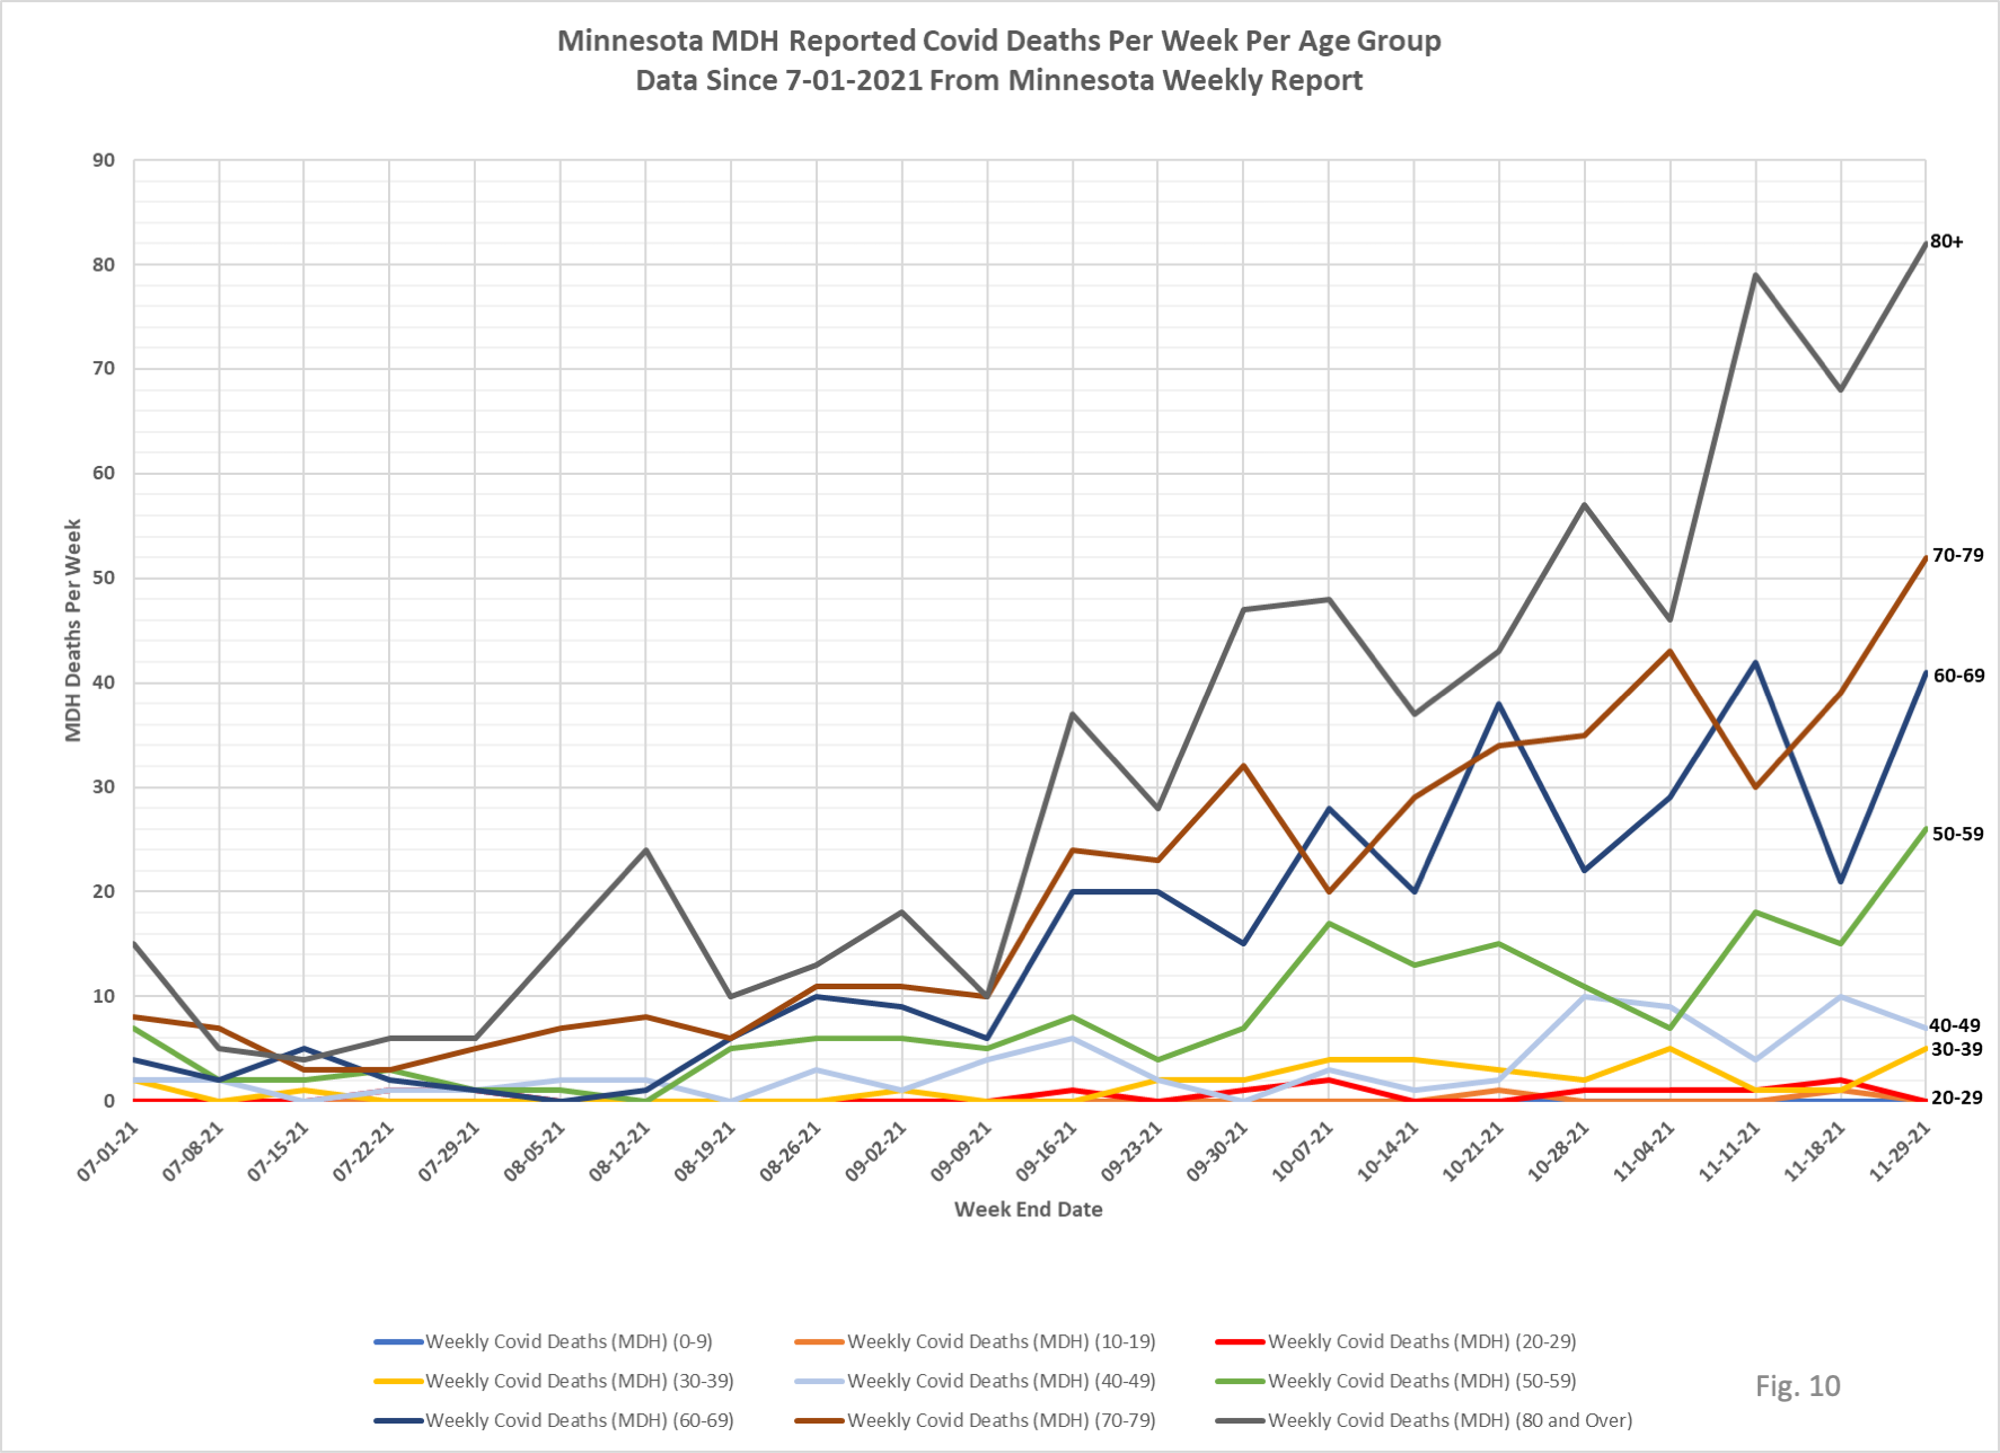
8. Fig. 9 and 10: Deaths Per Week. Total reported deaths for the week were 213, a large increase from 157 reported deaths the week before. There were large increases in all age groups 50 and above in age. Deaths remain very well correlated with age.
 The Healthy Skeptic is a website about the health care system, and is written by Kevin Roche, who has many years of experience working in the health industry. Mr. Roche is available to assist health care companies through consulting arrangements through Roche Consulting, LLC and may be reached at
  RSS - Posts